Our Car Audio Masterclass series offers a comprehensive introduction to the essential concepts of car audio systems, covering everything from basic terminology to advanced measurement techniques. To learn more, check out the other articles in the series:
- Car Audio Masterclass 101.1 – Audio Basics: Learn key audio terms and concepts.
- Car Audio Masterclass 101.2 – Understanding Basic Electricity: Explore voltage, current, and resistance.
- Car Audio Masterclass 101.3 – Electric Circuits: Understand series and parallel circuits.
- Car Audio Masterclass 101.4 – Magnetism: Discover the role of magnetism in speakers.
- Car Audio Masterclass 101.5 – Direct and Alternating Current: Compare DC and AC currents.
- Car Audio Masterclass 101.6 – AC Calculations: Dive into AC waveform calculations.
- Car Audio Masterclass 101.7 – The Decibel: Learn about decibel measurements.
- Car Audio Masterclass 101.8 – Speakers, Power, and SPL: Understand speaker power and sound levels.
- Car Audio Masterclass 101.10 – Digital Multimeter: Learn to use a multimeter in car audio.
We are back to learning the fundamentals of working with alternating current signals. In lesson CAM 101.6, we discussed the math behind sine wave voltage measurements and power calculations. This information assumed a basic understanding of different waveform analysis tools. In this lesson, we’ll focus on oscilloscopes for making audio signal measurements in the time and frequency domain and audio analyzers for making frequency-domain measurements.
Time Domain Measurements
Let’s kick off this lesson by discussing the oscilloscope. An oscilloscope is a device with a screen that shows voltages relative to time, which is why it’s called a time-domain measuring device. The first oscilloscopes were analog devices that used large vacuum tubes. It was simple for the electron gun at the back of the tube to produce a single light point on the screen. The position of the point would move left to right and up or down based on a few simple inputs. The vertical axis represents voltage, and the horizontal axis represents time. We will expand our oscilloscope drawing to include more information. We were introducing the BCA Megascope 2000000!
Modern oscilloscopes are digital units that provide the same information using digital-to-analog converters, microcontrollers, and color LCD screens. These newer solutions also allow for reasonably complex math to be performed and data to be stored for waveform inspection.
Oscilloscope X-Axis: Time Base
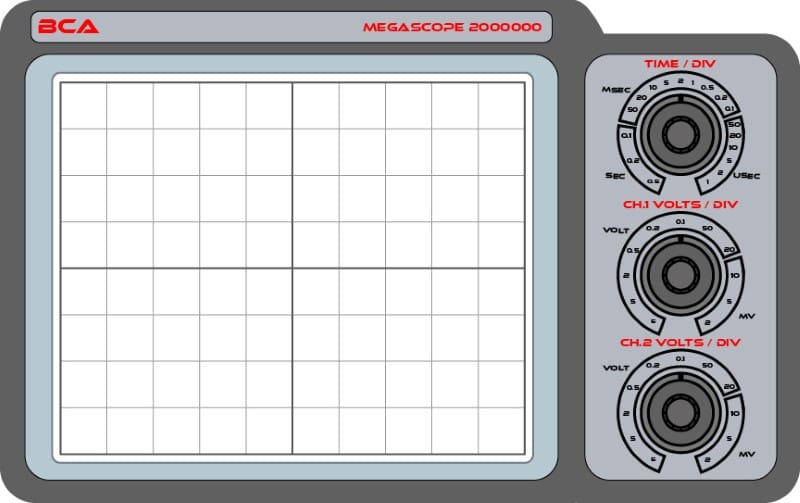
The X-axis represents time on our oscilloscope. The TIME/DIV control in the top right corner determines how quickly the waveform is drawn across the screen. You can think of it as controlling the lateral or sweep speed of the cursor. The settings on the control describe how much time each of the ten horizontal divisions on the display represents. The setting above is two milliseconds per division, meaning the cursor traverses the screen every 20 milliseconds. If we were to examine a 50-hertz waveform, a single cycle would fill the entire screen.
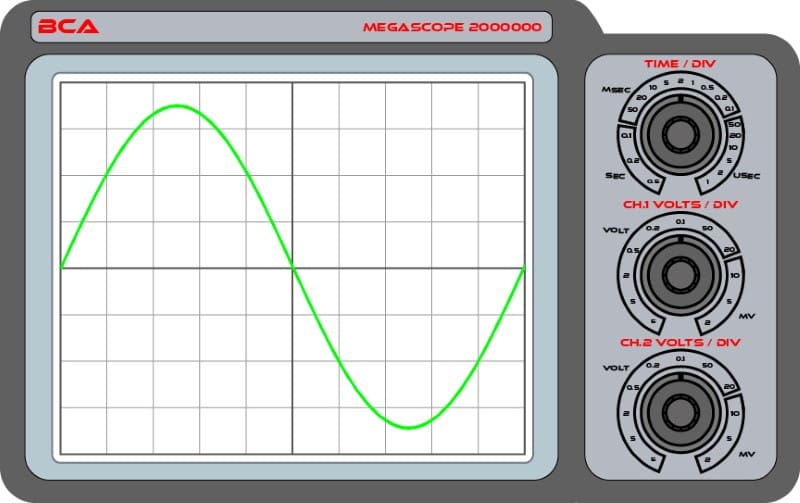
If we adjusted the time base to 10 milliseconds per division, we would see five cycles of a 50-hertz waveform.
When using a scope, we want to set the horizontal TIME/DIV to display waveform details clearly. For example, if we wanted to look at a 1-kHz waveform, which has a period of 1 millisecond, we’d set the scope to either 0.2 or 0.1 milliseconds per division to see it clearly. Remember, the adjustment sets the time per division, not the total time for the waveform to scan across the screen.
Oscilloscope Y-Axis: Voltage
We’ve already let the cat out of the bag: the vertical Y-axis shows the amplitude or voltage of a signal. The VOLTS/DIV control allows us to scale the amplitude of the display. In the sine wave shown above, each cell represents 0.1 volts. The waveform had a peak-to-peak amplitude of seven divisions, representing 0.7 volts.
The MegaScope 2000000 is a two-channel scope that can display two waveforms simultaneously. Each waveform has a VOLTS/DIV control. We can use these controls to measure the signal gain provided by an amplifier. By connecting one channel to the RCA input and the other to the speaker output, we can measure the peak-to-peak amplitude of the two signals to determine the ratio of output to input voltage.
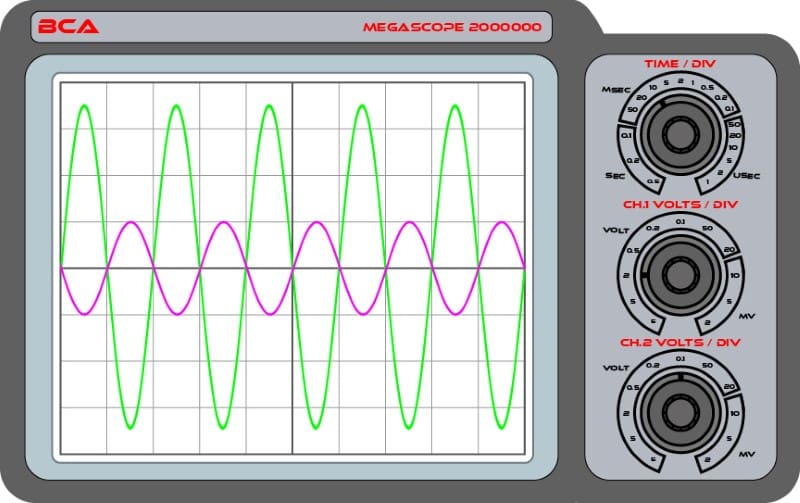
Looking closely at the scope display, we see that channel one is set to 5 volts per division. The green waveform is seven divisions high, which means the peak-to-peak voltage is 35 volts. Channel 2, represented by the violet trace, is set to 0.1 volts per division. The waveform is two divisions high and has a peak-to-peak voltage of 0.2 volts.
We know the frequency of both waveforms is the same because the zero-crossing points align. We can also see that one waveform is inverted or has reversed polarity compared to the other. The violet trace goes down when the green trace rises, and vice versa. Whether the amplifier inverts the signal depends on where the probe is connected for measurements. If both probes are connected to positive terminals, the amp is inverting the signal. As an important side note, we would never describe this waveform as 180 degrees out of phase. We can’t know that unless we know when each waveform started. The proper terminology is noted above.
A modern oscilloscope has dozens of other valuable features and functions. College and university students studying electronics will spend months learning how to use a scope to make amplitude and phase measurements.
Frequency-Domain Signal Analysis
A scope is a crucial tool for working on car audio systems, but it has some significant limitations. Music, for example, contains much more than just one frequency. The image below shows a waveform that combines two frequencies.
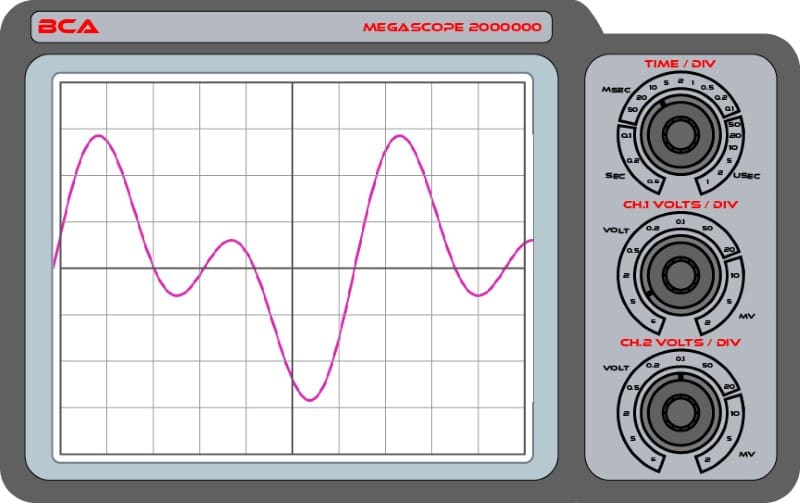
The information shown above is essential for determining the maximum signal amplitude, which might help set the gain controls on an amplifier. However, we can’t extract any relevant information about the amplitude of each waveform. To do that, we need to introduce frequency-domain analysis.
The Audio Analyzer
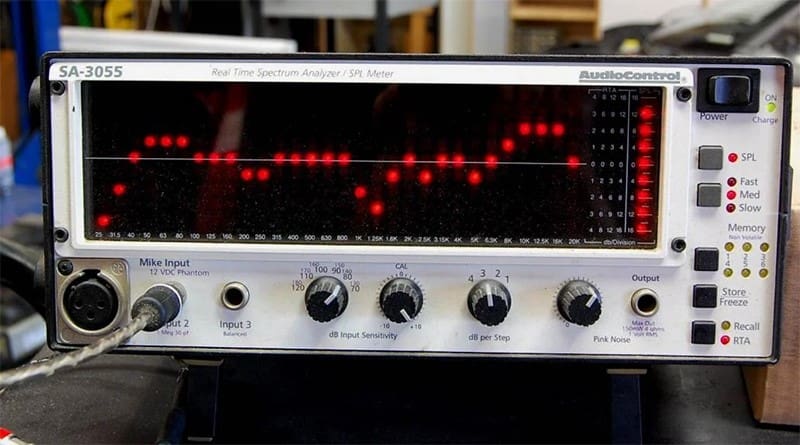
Often called an audio analyzer, computers can extract the amplitude of different frequencies and display that information on a screen. For those who have been around the car audio industry for some time, the venerable AudioControl SA-3050 and SA-3055 are staples.
These days, most car audio technicians use computer-based analysis tools to make electrical and acoustic measurements.
Fourier analysis takes an analog waveform and extracts the amplitude of the individual frequencies it contains. While painstakingly slow on paper, computers can quickly perform this complex math.
Audio Analyzer: Need-to-Know Information
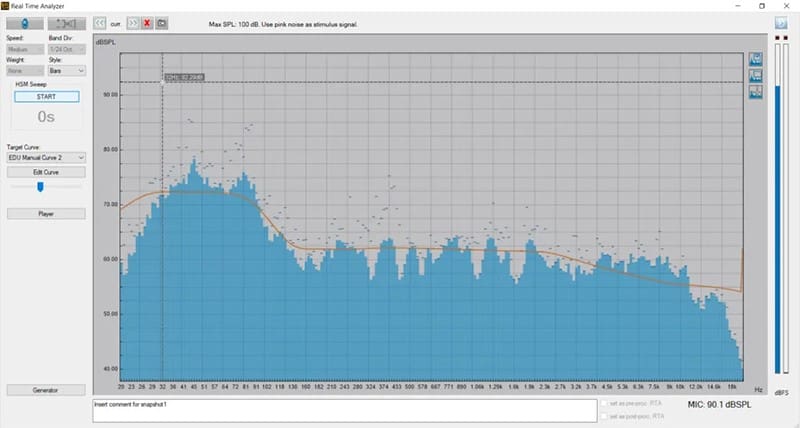
A few critical pieces of information are required to understand the data provided by an audio analyzer. The horizontal scale typically shows frequency. In the case of the AudioControl devices, there are 30 frequency bands spaced at 1/3-octave intervals. There is an amplitude indicator at 1, 1.25, and 1.6 kHz.
The Audison system is set to 1/24-octave mode. This means the data shown has eight times more frequency detail than a scope set to 1/3-octave resolution. However, more isn’t always better, and those with extensive car audio system calibration experience know what information to work with and what to ignore.
The second critical piece of information is the vertical scale. This shows the amplitude of each frequency. Most audio analyzers display amplitude in some form of decibel scale. The scale is typically dB SPL when making acoustic measurements of audio signals. When looking at electrical waveforms, the scale is usually decibel volts or dB V. This scale needs to be expanded enough to see sufficient detail to make the measurement relevant. For example, if we aren’t zoomed in enough on acoustic measurements, small peaks and valleys in the response might disappear, making the system appear to have a flat response. If we zoom in to find peaks of five dB and dips of eight to ten dB, we know a system still needs a lot of work.
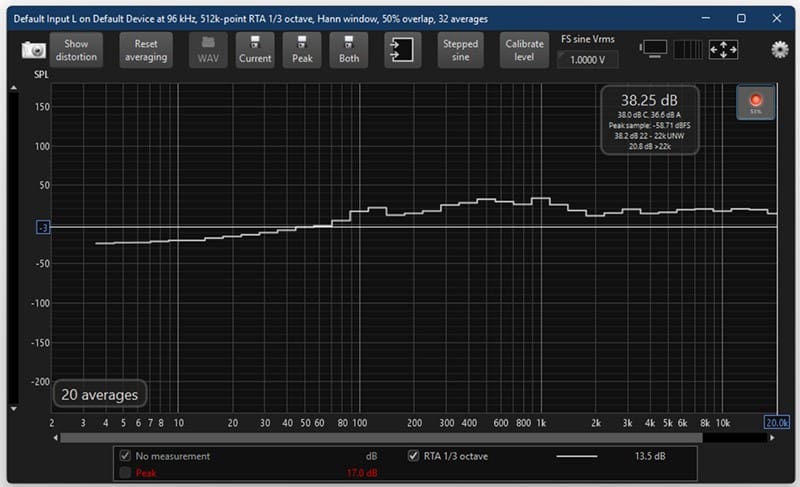
The image above shows a 1/3-octave measurement of our office. A moderately large fan is about 10 feet from the computer. Overall, the background noise looks reasonably even across the audible range of human hearing.
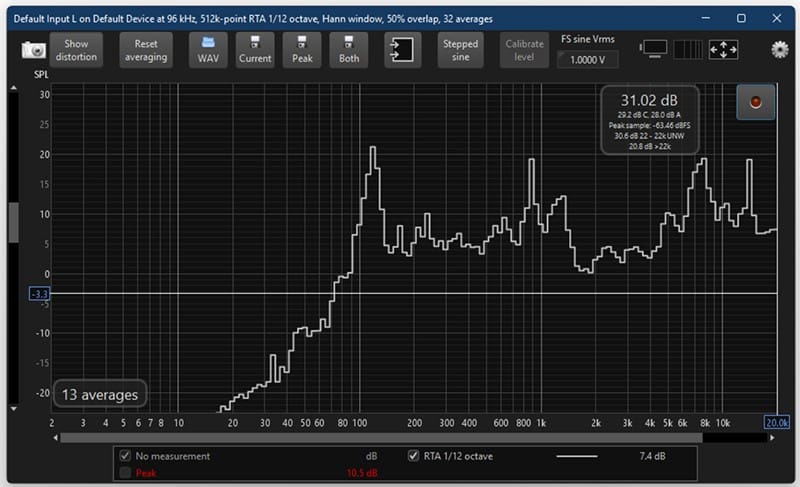
We have now zoomed in so that the vertical scale clearly shows 1 dB steps. We’ve also increased the frequency resolution to 1/12-octave. We can now see a spike at 119 hertz, roughly 14 dB above the baseline noise. There’s another spike at 888 hertz that’s about 12 dB tall. Depending on your goals for extracting information from a frequency-based measurement, this level of detail might be crucial.
Interpreting Frequency-Domain Measurements
One critical quality assessment we make when reviewing car audio amplifiers is evaluating how an amplifier affects a signal being passed through it. For example, we might feed an amplifier a 1 kHz test tone to evaluate total harmonic distortion. That would look like a single spike at 1 kHz on the spectral response graph.
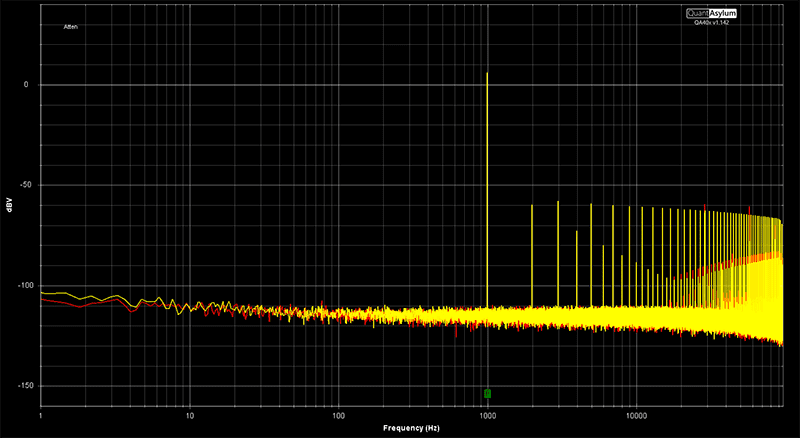
The image above shows the abysmal performance of a low-quality class-AB amplifier. We can see the original test tone at six dBV (2.0 volts) in the center of the graph. The amp adds all the harmonics at two, three, four, five, six, and so on. This is the best example of atrocious harmonic distortion performance we’ve seen to date. The higher the sum of the harmonics relative to the fundamental signal, the higher the THD. In this case, the amp added 0.187% THD. That’s equivalent to the amp adding unwanted information to every frequency that goes through it at a level that’s 54.53 dB below the original signal.
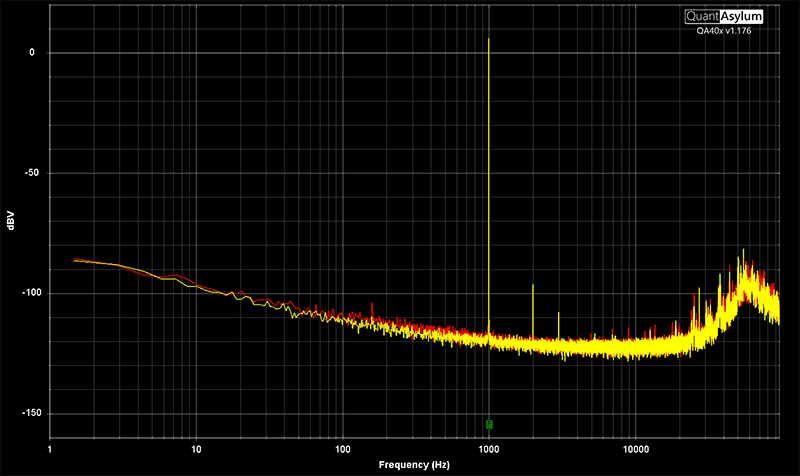
The image above shows the harmonic distortion added by a high-quality class-D amplifier. Here, we see a second harmonic at about -96 dBV and a third at about -107 dB. These harmonics are at -101.68 dB relative to the test tone. That’s like 0.00082% THD.
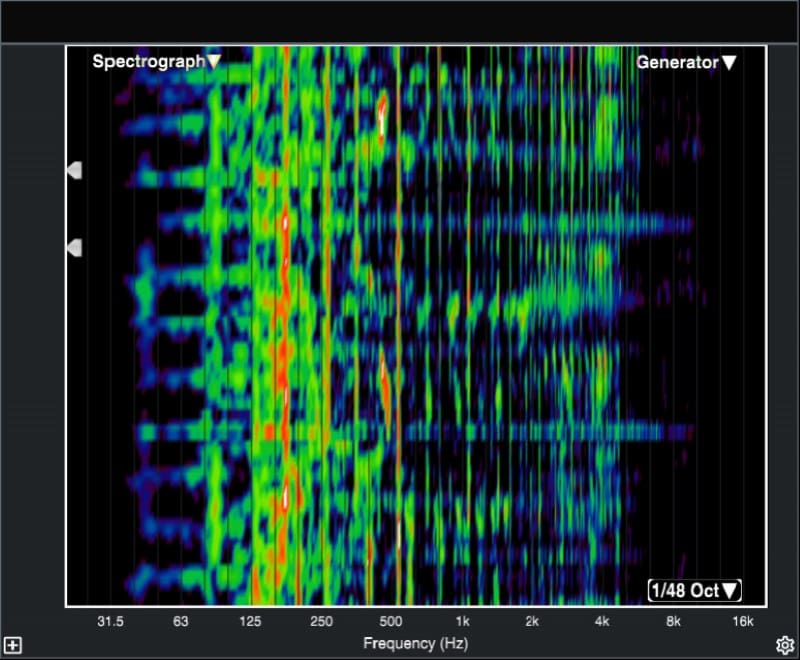
The Spectrogram
A signal analysis format that combines time, frequency, and amplitude into a single piece of information is called a spectrogram. The vertical scale in the image below represents time. The data scrolls up the screen at a specific rate configured in the software. The horizontal scale represents frequency, just like our audio analyzer. In most cases, 20 Hz is on the far left of the screen, and 20 kHz is on the far right.
A color represents the amplitude of each frequency analyzed. Levels that are below the user-set threshold are typically black. As the signals increase in amplitude or intensity, they turn violet, blue, green, yellow, red, and white. The brighter colors indicate higher levels.
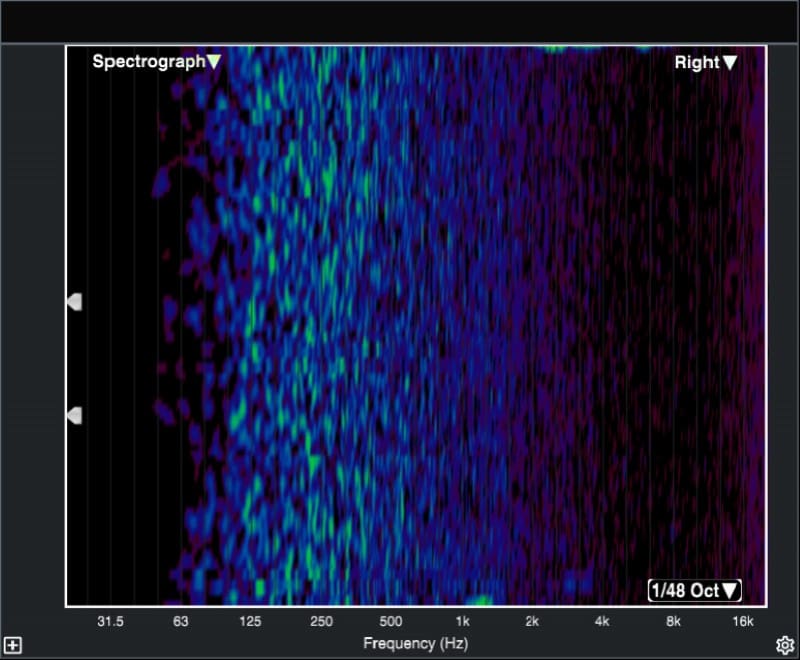
Spectrograms aren’t typically used for scientific analysis but are incredibly useful for real-time monitoring. We could configure the colors to show a very narrow amplitude window. The beauty of a spectrogram is that we can see what just happened. For example, if someone used one during a live performance and experienced feedback or distortion, they could look at the display to see what frequency it occurred. Feedback would look like a loud vertical stripe in the graph.
The image below shows the spectrographic analysis of “Go Your Own Way” by Fleetwood Mac. It was the first WAV format file we could find on the server.
Audio Signal Measurement is Crucial to Car Audio System Calibration
The proper tools to measure audio signals in time and frequency domains are crucial for installing car audio systems in modern vehicles. Technicians start by measuring the factory-installed sound system’s frequency, amplitude, and phase response. Then, they finish configuring the new equipment with the same measurements. When done correctly, your car audio should sound magnificent.
The tenth and final lesson in Car Audio Masterclass 101 will cover the different ways to use a digital multimeter.
