
Last week a friend of mine sent a link to a YouTube video by Steve Meade, who was experimenting with line output converters using an oscilloscope and an SMD DD-1+ distortion analyzer. Several statements in the video and the comments made it clear that people don’t understand the concept of audio signal distortion. That’s OK. It’s a complex subject and requires looking at signals in the frequency domain rather than the time domain. See, already complicated. Don’t fret. I’ll make it all make sense.
Let’s Start with Some Definitions
Before we dive into distortion, we need to understand the difference between the frequency and time domains. Let’s start with something much less confusing than an oscilloscope or audio analyzer – enter the multimeter. A multimeter is a device that can measure DC or AC voltage, resistance and current flow. If we set our multimeter to measure DC voltage and connect it to a car battery, we’ll see around 12.8 volts. If we switch the meter to measure AC voltages and carefully poke the test leads into an electrical outlet in our home or office, we’ll see around 120 volts.
If we take things a step further, we can look at these or similar signals using an oscilloscope. An oscilloscope measures and displays voltage over a period of time. If we look at a DC voltage, we see that the level remains constant as the trace scans across the screen.
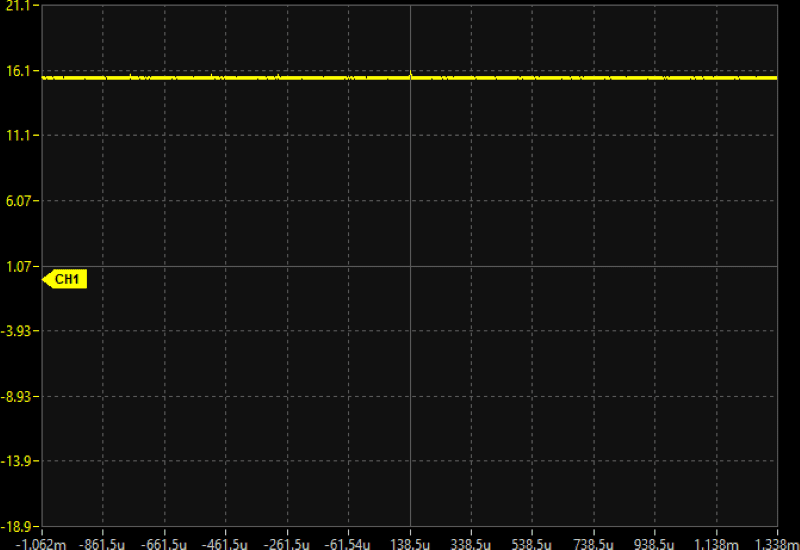
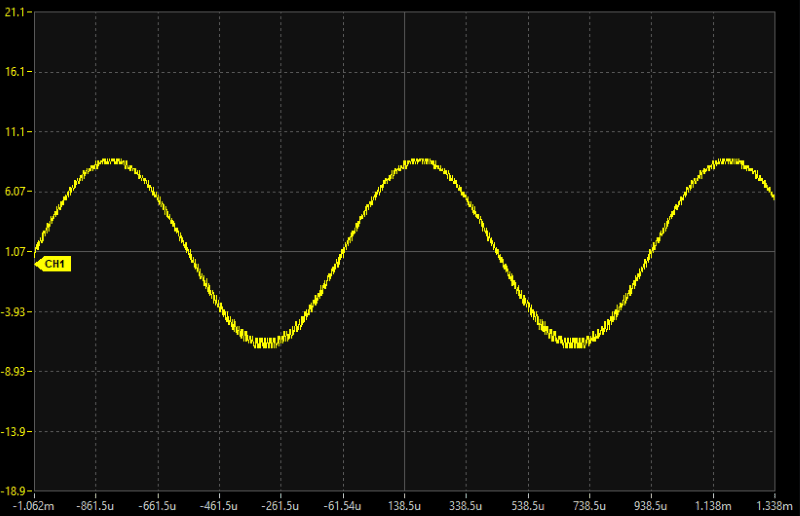
Looking at an AC voltage on an oscilloscope, we can see the amplitude move up and down as the trace moves across the screen. The person making the measurement will set the scope to determine the speed at which the waveform is sampled (in milliseconds or microseconds per division) on the horizontal scale and the voltage per division on the vertical scale. In the example below, I’m playing a 1 kHz test tone on the impressive Sony XAV-9500ES multimedia receiver I reviewed in early 2022. The measurement shown on the scope above is at a level of 5.28 volts RMS.
As we advance, let’s focus on what’s happening with the AC waveform, since that’s what makes up audio signals and is crucial to our understanding of harmonic distortion.
Let’s look at that same signal in the frequency domain using my QA402 audio analyzer.
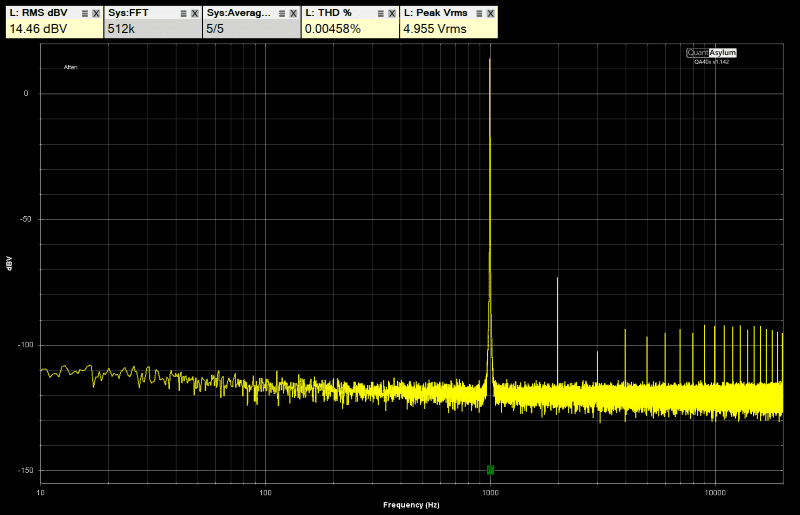
To make sense, I need to explain what you’re looking for on the analyzer for the rest of this article. First, the vertical scale is in decibel volts. To see how this scale works, give my recent article on decibels a read. The horizontal scale is frequency. I have the analyzer set to display 10 Hz to 20 kHz, though Sony can easily reproduce audio signals to almost 100 kHz on the analog outputs.
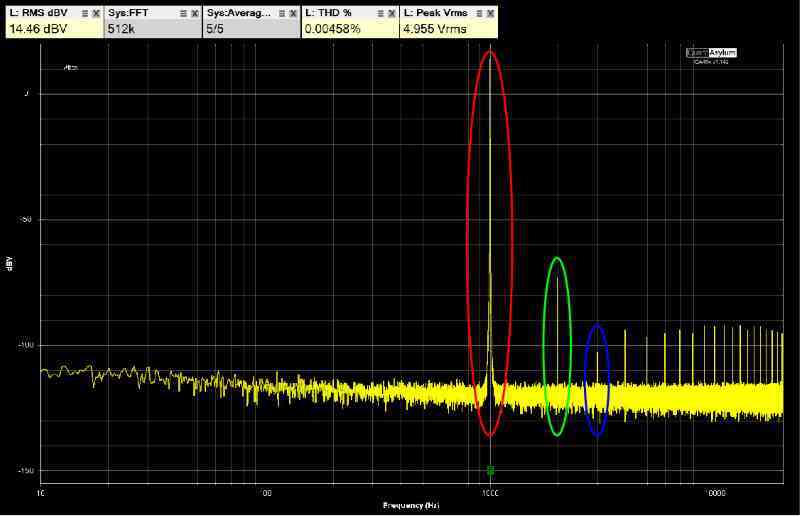
The peak at 1 kHz at a level of 14.46 dBV correlates perfectly to what we saw on the scope. A measurement of 14.46 dBV is equal to 5.284 volts RMS. The background noise produced by the source unit is the yellow band of hash or fuzz across the bottom of the screen between -115 and -125 dBV. Keep in mind that this is a high-end signal source, not some run-of-the-mill radio that sells for a couple hundred dollars. A measurement of -120 dBV is 0.000001 volt or 1 microvolt. This is an exceptionally small amount of noise.
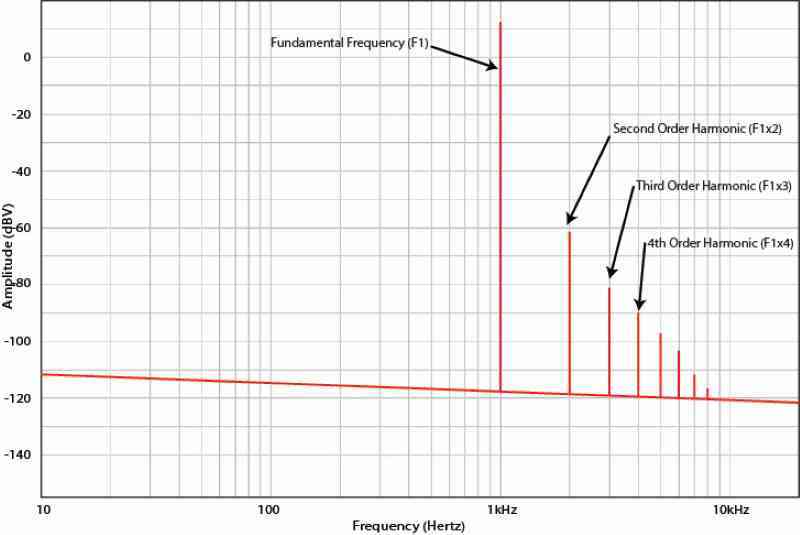
Now we know the test signal amplitude and the level of the noise floor. Next, we need to look at the rest of the information in the frequency-based analysis of what the source unit is producing. Look at the analyzer information, particularly at the small spike at 2 kHz (circled in green below) at a level of about -73 dBV. This 2 kHz information wasn’t present in the original recording. It was added by the electronics in the source unit. The same goes for the -103 dBV trace at 3 kHz (circled in blue), the information at 4k, 5k, 6k and so on.
When any signal passes through a resistor, capacitor, diode, op-amp, transistor, inductor or even along traces on a circuit board or through a wire, varying amounts of distortion are added. For traces, wires or resistors, the added distortion might be so small that it can’t be measured easily. For an op-amp or transistor, the added distortion might be noticeable. When the audio signal passes through dozens or hundreds of components, minute amounts of distortion can add up to something unfavorable.
In the case of this particular measurement on the Sony XAV-9500ES, the distortion amounts to 0.00458%. This means that 0.00458% of the information in the signal is inaccurate. This is an exceptionally low distortion measurement.
Let’s look at a different source unit. My friend Cory sent me a cheap, unbranded Android-based car audio head unit. I’ll play the same 1 kHz test tone and look at the frequency-based content.
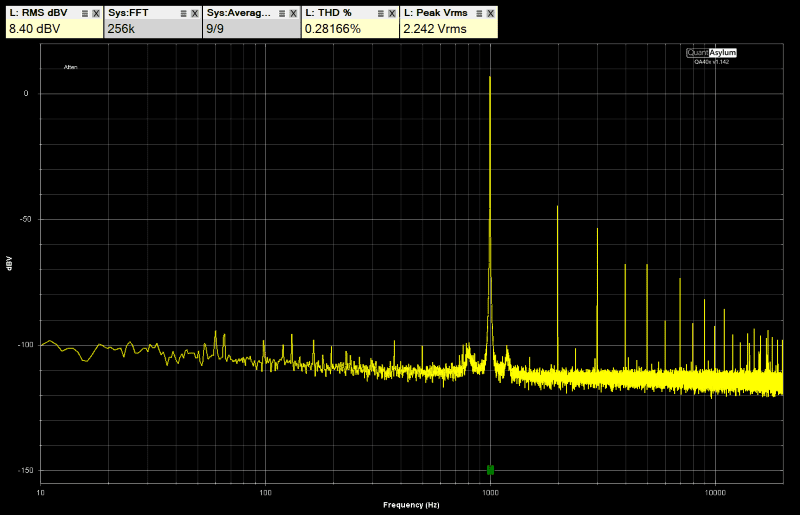
While this is a demonstration that’s clearly “one extreme to the other,” it does a good job of showing what you get when choosing a high-quality product over one that’s mediocre (at best).
Instead of the second harmonic being ~87 dB below the fundamental frequency, the Android unit adds significantly more unwanted harmonic content. The second harmonic at 2 kHz is at a relative level of -51.6 dB V and an absolute amplitude of -44.6 dBV. That equates to a 2 kHz voltage of 5,888 microvolts. As a reminder, the first harmonic produced by the Sony radio was at a level of 224 microvolts. That’s 26 times as much distortion. In terms of a THD specification, the Android is at 0.28%.
It Gets Worse!
So far, we’ve looked at a single tone. Now, remember that music and voices are made up of various frequencies. So, for every frequency passed through a device, harmonics are created. Let’s look at what happens when multiple frequencies play simultaneously. I’ve created a second test tone track with 1.0, 1.1, 1.2, 1.3 and 1.4 kHz sine waves recorded at -15 dB FS.
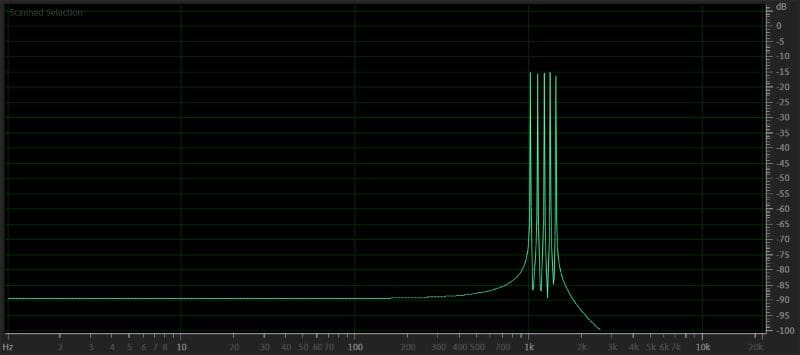
As you can see in Adobe Audition’s frequency analysis window, there are the expected sine wave peaks at the frequencies I described earlier.
With the Sony playing these tones, we can see harmonics at 2 kHz, 2.2 kHz, 2.4 kHz and 2.8 kHz. The loudest, or highest in amplitude, is at a level of about -90 dBV. Once again, this is an exceptional performance.
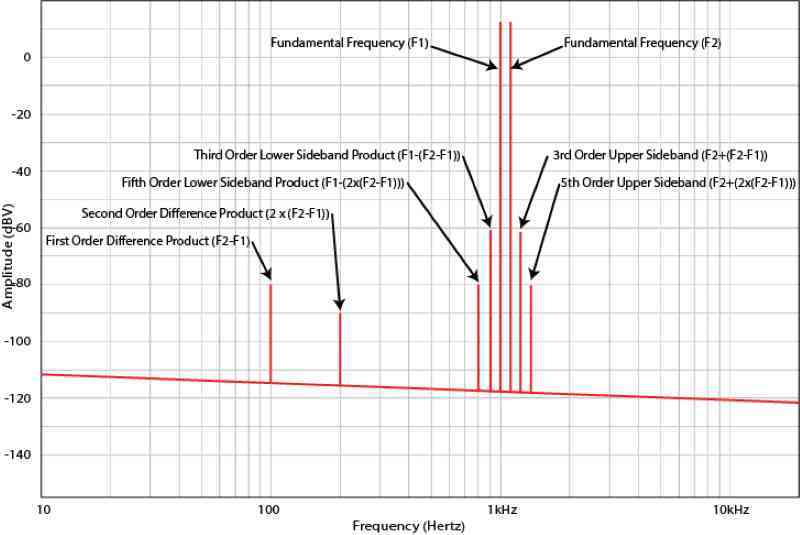
We also see some new information added to the output. There’s a frequency spike at 100 Hz. What the heck is that, and why is it there? Well, That’s intermodulation distortion. The difference between 1.0 kHz and 1.1 kHz is 100 Hz. The difference between 1.1 and 1.2 kHz is also 100 Hz. See the pattern? There are also spikes at 200 Hz (the difference between 1.0 kHz and 1.2 kHz), at 300 Hz (the difference between 1.0 kHz and 1.3 kHz) and finally at 400 Hz, which is the difference between 1.0 and 1.4 kHz. The highest amplitude is the 100 Hz tone since four frequencies share this spacing. The amplitude of the 100 Hz intermodulation distortion product is still very low in amplitude at -87 dBV.
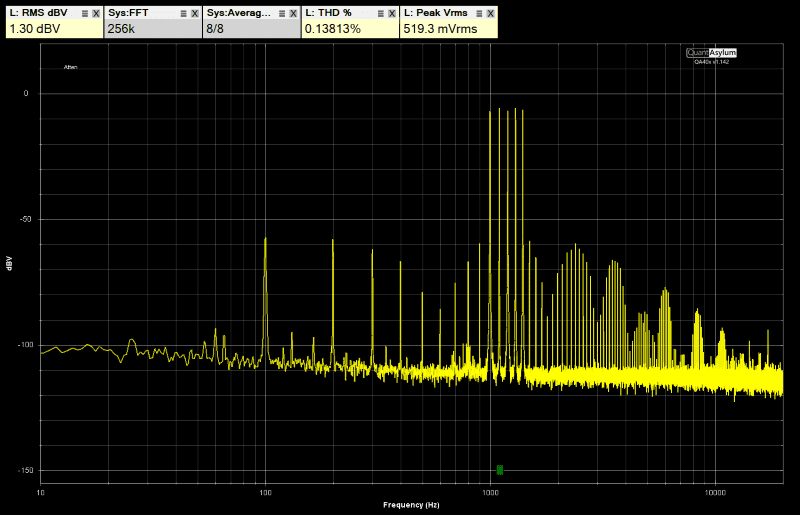
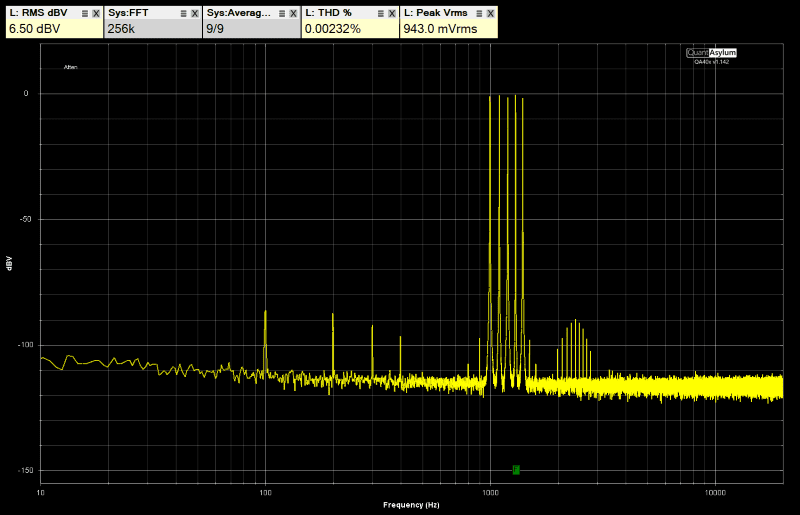
Now we have the Android radio, and oh boy, do we have a mess on our hands. First, let’s look at the amplitude of the harmonic distortion. The peak at 2.4 kHz is relatively high in amplitude -60 dBV. Then, there’s another set of harmonics an octave up from those with the 3.5 kHz peak at -66 dBV. Finally, you can see four more sets of harmonics, though their amplitude is finally getting down where they are hard to hear.
Now for the Intermodulation distortion analysis. The 100 Hz and 200 Hz products are at -57 and -58 dB V, respectively. This is poor performance and would be called 0.15% IMD distortion. There is something else added to the output. We now have information at 900 and 1500 hertz that wasn’t in the recording. These are called sidebands. This frequency content is distortion caused by that frequency spacing of 100 Hz between the test signals. There are also 800 and 1600, 700 and 1700 and 600 and 1800 hertz bands added. These same sidebands existed in the output of the Sony Mobile ES source unit, but their highest amplitude was down around -97 dBV – which is microscopic.
Have you ever wondered why many reputable mobile enhancement retailers refuse to sell or install these no-name Android-based source units? This distortion performance is just one of the easily measurable reasons.
Let’s bring this full circle and look at the Android radio’s output playing the 1 kHz tone on the oscilloscope.
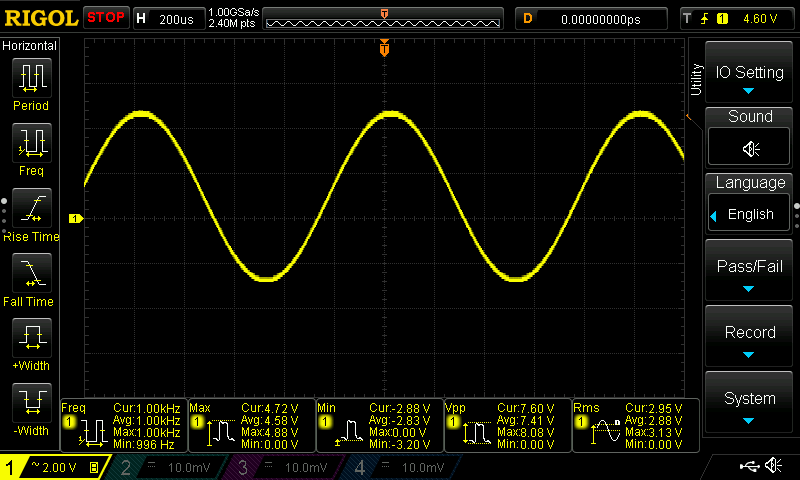
Maybe it’s surprising to some, but the waveform on the scope doesn’t look bad at all. An oscilloscope is a good tool for checking when a waveform reaches clipping but does almost nothing to tell us when there’s harmonic distortion in the signal.
The second takeaway from this article is that harmonic and intermodulation distortion happen at all volume levels and are independent of clipping. All source units, amplifiers and signal processors add distortion that isn’t visible on the scope. Distortion exists long before any audio component is pushed to the point of clipping. You know all those videos of products that lit up the 1% distortion LED on the DD-1 before they clipped? The DD-1 was working ideally – the products add distortion.
What Is Distortion?
Let’s revisit the video that brought this topic up. At the end of the video, Steve called Tony D’Amore to discuss his findings. Tony mentioned that the strange waveforms shown on the oscilloscope contained frequencies in the output that weren’t in the test signal. Steve tried to explain that he only sent a single tone to the interfaces. This statement was what prompted this particular article. Harmonic distortion is the addition of unwanted harmonic information to the output that wasn’t present in the original signal. Intermodulation distortion is content added based on the difference between two frequencies in the original signal. If we look at the performance of the Sony head unit, there’s a minimal amount of unwanted frequency information added. If we look at the Android, it’s a disaster. This distortion is what Tony was talking about. Distortion is frequency content added to the output of a device that wasn’t present in the original recording.
Now imagine a band playing a half-dozen instruments and someone signing, or a full-scale symphony orchestra with 100 performers and perhaps as many as 20 different instruments. A low-quality audio product would add a massive wash of harmonics and intermodulation products to the output of that recording. For every note, there would be harmonics. For every chord, there would be products and sidebands. Then the same thing happens with different instruments playing at the same time. The frequency analysis would look like something a kindergartener might create with crayons.
In summary, harmonic distortion is the addition of unwanted content multiples of the frequencies contained in an audio signal.
Intermodulation distortion is unwanted content that is the difference between two frequencies in an audio signal. In addition, that different frequency (called the different product) may create unwanted content on either side of the two primary frequencies.
Quality Is Inversely Proportional to Distortion
While most car audio companies don’t share adequate and accurate enough information to make a product selection based on specifications alone, the fact remains that how we perceive the quality of a product is inversely proportional to the distortion it adds to our music. When something sounds clean, crisp and accurate, the harmonic and intermodulation distortion characteristics of the entire system will be minimal. On the other hand, if an audio system sounds bright, boomy, warm or sloppy yet has a relatively flat frequency, then the components in the system are likely adding a lot of unwanted distortion.
Drop by your local specialty mobile enhancement retailer today to find out about the high-performance audio products that are available to transform the listening experience in your car or truck into something extraordinary.
