If you’ve been a reader of BestCarAudio.com, you know we’ve published a lot of articles about distortion. We include detailed measurements of harmonic and intermodulation distortion in our Test Drive Reviews to help show you the quality and performance differences between products. In this article, we’ll make a series of speaker distortion measurements using our new Clio audio analysis hardware to explain why investing in the best quality speakers you can afford is crucially important.
An Overview on Distortion
Before we start talking about distortion, we ask that you forget about amplifier clipping. That’s not what we’re talking about here. Yes, clipping IS the addition of significant amounts of unwanted information to an audio signal. With that said, clipping should only happen when an audio system isn’t designed or operated correctly.
The distortion we are discussing happens in low, mid and high volume levels and comes from every component in the audio signal path. Source components in an audio system add a small amount of distortion. Quality amplifiers shouldn’t add much unwanted information when operated in their linear range. On the other hand, speakers can easily add a lot of distortion.
Any time information is added to the original recording, that’s distortion. It could be hiss from an improperly configured processor or harmonics from a poorly designed amplifier. Have a look at this article (https://www.bestcaraudio.com/what-do-better-car-audio-amplifiers-sound-like/) that discusses the performance differences between low-, medium- and high-quality car audio amplifiers to get a feeling for just what they add to an audio signal.
Let’s look at a theoretical example of distortion before we dive into measuring any speakers. Imagine that we’ve created a single-frequency test tone to evaluate the distortion characteristics of audio equipment.
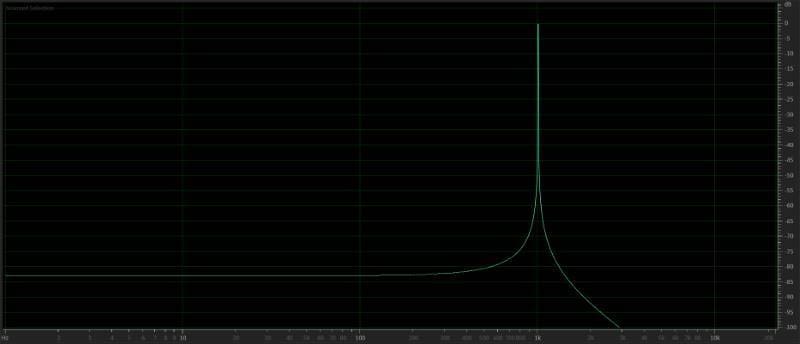
The graph above shows a spike at 1 kHz. There’s nothing else of significance in the display.
Next, we might play the above recording of a 1 kHz tone through a medium-quality source unit. Though it can be subtle, every audio component will add a number of harmonics to the signal. The output of our head unit might look like the graph below.
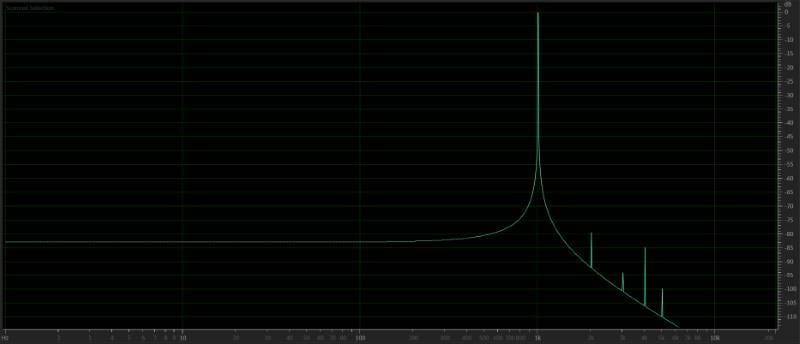
The graph above shows the same 1 kHz tone, but harmonics have been added to the signal at 2, 3, 4 and 5 kilohertz. The loudest harmonic, measured at 80 dB below the original signal, would represent a signal distortion of 0.010%.
The source unit has added information to the audio signal that wasn’t in the original recording. For example, the small spike at 2 kHz is second-order harmonic, the spike at 3 kHz is third-order, and so on. The relative level of the even and odd harmonics can give the audio component a harsh sound or make it sound unintentionally warm. Either way, the sound has changed from the original recording, and that’s not what we want any audio device to do.
Passing that slightly distorted audio signal into an amplifier will have the same effect. It will create multiples of any and every frequency that passes through it. So, it will add more unwanted information at 1, 2, 3 and 4 kilohertz, along with harmonics of each of those frequencies as they were present in the signal going into the amp. Below about -110 dB, you aren’t going to hear that information. We’ll get into another deep discussion of intermodulation distortion as we prepare to evaluate speaker configurations.
Let’s Test a Car Audio Speaker
It’s easy to create a low-quality speaker. Guess at a cone mass, pair that with some random voice coils, spiders and surrounds, then glue them together, plop those parts in existing baskets and put a label on the box. If you think there are speakers on the market that aren’t created this way, you’re wrong.
A good speaker is typically designed backward, from a target performance objective. For example, the aim could be a smooth response through a particular range of frequencies, enhanced low-frequency extension or maximum output efficiency. Most often, a group of these characteristics are combined during the development phase. Once the guidelines have been established, an engineer can model different components in simulation software. Once a plan is in place, parts can be developed to hit target mass, dimensional, compliance and electrical characteristics.
The companies with a wealth of knowledge in designing and testing speakers have a foundation for what works in each application. As such, hitting a target performance goal is more efficient and the results more accurate. Some companies use test equipment that combines acoustic measurements with laser-based cone movement measurements to evaluate samples and adjust or fine-tune the design. Hardware like this is available from Clio and Klippel.
No matter how hard the engineer tries, designing and producing moving coil loudspeakers is challenging. A little too much or too little glue can change performance. A misalignment of the vertical height of the coil to the cone and spider can result in non-linear performance. It’s easy to get this all wrong, and as such, it’s difficult to produce speaker products that are consistent in offering excellent performance.
Let’s Measure Speaker Distortion
We will start this evaluation of speaker distortion by testing a 6.5-inch coaxial speaker that was introduced to the car audio market in 2004. I knew from the first time I heard it that there was something odd with the design. First, there’s a sharpness in the upper midrange that’s quite unpleasant. The second reason I chose this driver is that it has the tweeter mounted right at the base of the woofer cone. (Why this is important will be revealed in an upcoming article.)
Let’s set the speaker up in my 2.2-cubic-foot test enclosure and measure the driver’s frequency response at a drive level of 1 volt and the microphone at 0.5 meter. The results are in the graph below. Ignore what’s happening below 30 Hz – those are room reflections.
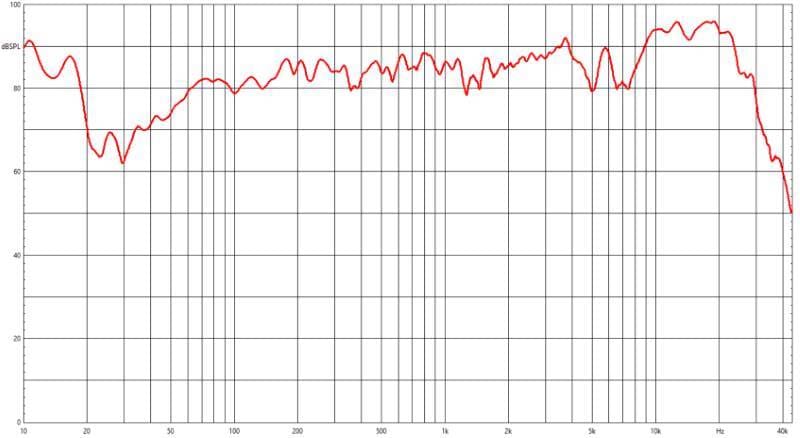
The measurement above tells us a few things. First, there’s a nasty dip of 10 dB at 5 kHz and a second dip that extends from 6.5 to 7.4 kHz. Second, it also has a LOT of energy in the top end, rising steadily from 2 kHz to be almost 10 dB louder than the midrange level. Even if these measurements don’t correlate directly to what might be found in an anechoic chamber, they give us a clear idea about what’s going on with the speaker design.
Let’s Look at Distortion
The Clio measurement system can measure total harmonic distortion and precisely quantify second- and third-order harmonic content. So let’s sweep this speaker again at the same drive level and look at the distortion output. Once again, please ignore the bass information below 30 Hz.
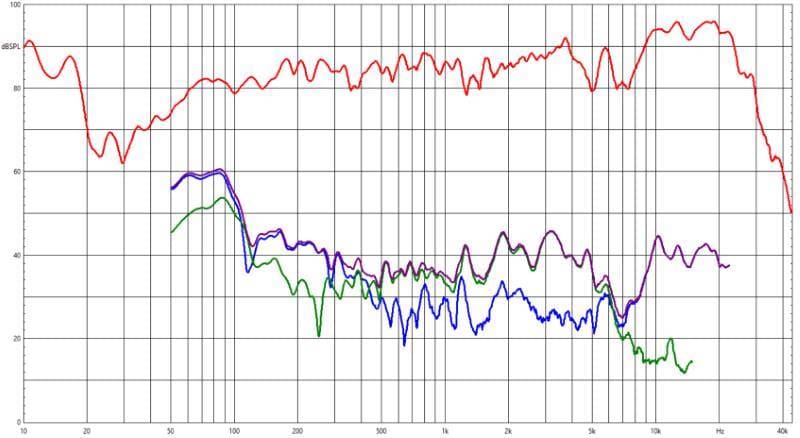
The red trace is the measured frequency response of the speaker that we saw previously. The blue trace is the level of unwanted second-order harmonic distortion. The green trace is the level of third-order harmonic distortion. Finally, the violet trace is the sum of all the distortion content produced by this speaker.
To clarify these measurements, when the speaker is fed a signal at 200 Hz and reproduces that tone at an output level of 85 dB, it will also produce output at 400 Hz at a level of 42 dB and 800 Hz at 34 dB. The 400 and 800 Hz sounds were NOT in the original recording. These characteristics repeat for every audible frequency. So tones at 201 Hz have 402 and 804 Hz harmonics added, 202 Hz tones have 404 and 808 Hz harmonics, and so on across the entire frequency spectrum.
We can see that below 500 Hz, distortion increases quickly as frequency decreases. This phenomenon becomes clearly apparent at about 125 Hz where the total distortion jumps to 21 dB below the primary signal. That’s equivalent to about 10% THD. From 500 to 1 kHz, the distortion level is fairly constant at around 45 to 50 dB below the fundamental signal. That works out to between 0.3 and 0.5% THD.
The type of distortion that is added changes based on frequency as well. Below 500 Hz, the distortion is primarily the second-order blue trace. This kind of distortion is usually because of variances in suspension compliance and magnetic field linearity. Above 500 Hz, the distortion becomes primarily third-order, which can be attributed to changes in inductance. Above 1 kHz, distortion is usually based on cone and surround resonances. When we refer to changes in a characteristic, we are talking about variations in cone position and drive level.
The Tip of the Iceberg in Speaker Distortion
As mentioned, this is a preliminary introduction to speaker distortion. We’ll follow up with additional tests on speakers over the next few months to help explain the differences between low-quality and premium solutions. In the meantime, if you’re shopping for speakers, let your ears do the math for you. Drop by your local specialty mobile enhancement retailer to audition the upgrade solutions available for your car or truck.
