 In any discussion about understanding sound, the unit of decibels will undoubtedly become part of the conversation. Unlike almost all other units of measurement, the decibel is not a linear scale. That is to say, 1 decibel (also written as dB) is not one-tenth the amplitude or strength of 10dB. In this article, we’ll explain how the decibel scale works and present some reference information to help you understand how the decibel scale works.
What is Sound?
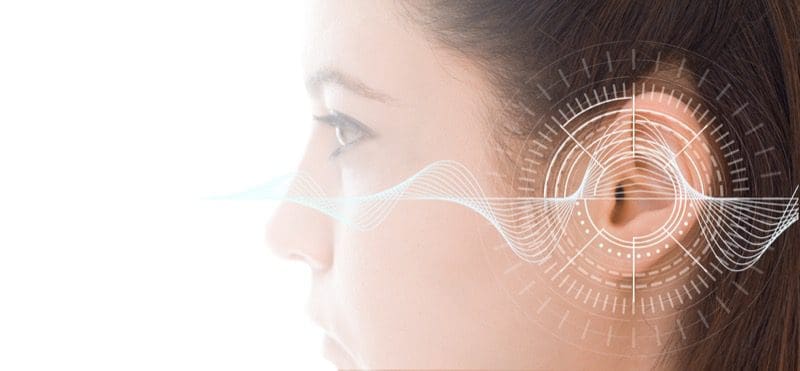
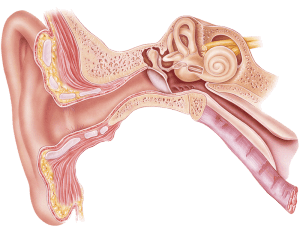 Sound is a vibration of air molecules that vibrates our eardrums. The eardrum passes these vibrations through to the middle ear through tiny bones called ossicles. The inner ear has a shape similar to that of a snail shell and contains microscopic hair cells that convert these vibrations into minute electrical signals. These signals are transmitted to the hearing nerve and subsequently to our brain. Each inner ear contains roughly 18,000 hair cells, all of which are said to fit on the head of a pin. Once a hair cell is damaged, it never grows back or repairs itself.
Understanding the Decibel
The decibel unit was created in the 1920s by Bell Telephone Laboratories to describe losses in communication cables used in early telephone systems. The original unit was MSC (Miles of Standard Cable) and was the loss of signal in 1 mile of cable at a frequency of 795.8 Hz that was equivalent to the smallest perceivable attenuation detectable to the average listener.
The Decibel and Sound Level Measurement
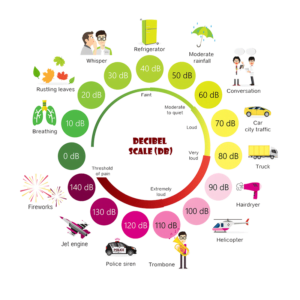 When discussing sound levels, the proper format is to use the unit dB SPL, dB(SPL) or dBSPL. The reference for any statement is the sound pressure as compared to 0dB. 0dB is defined as the perceived sound of a mosquito at a distance of 10 feet from the listener.
Because dB SPL expresses a ratio, sounds can be quieter than 0dB. Imagine if you will, you are in the space where the sound created by that original mosquito was measured. If we take away the mosquito, the space will be quieter. How much quieter depends on other sources of noise. Electrical noise created by lighting and noise caused by heating and cooling systems all contribute. If we eliminate as many noises as possible, the room will get quieter and quieter.
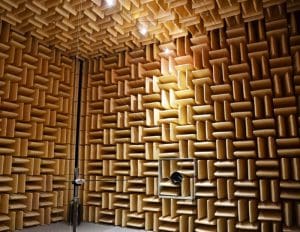 According to Guinness World Records, the quietest place in the world in 2012 was an anechoic test chamber at Orfield Laboratories in Minneapolis. The sound level in this room was measured at -13dBA. In October 2015, a team of engineers at the Microsoft head office in Redmond, Washington, smashed this record with measurements taken in the anechoic chamber in Building 87. A team of independent specialists measured a noise level of -20.35 dBA. The room is not only completely isolated from all sources of noise and vibration, but the walls are lined with large acoustic foam wedges design to absorb sound.
At the opposite end of the sound spectrum we have 191 dB SPL. This is the sound level where the air is pressurized to 1 Bar or 1 atmosphere. Linear sound cannot exist above this level because the low-pressure side of the wave reaches an absolute vacuum. There are louder noises (such as nuclear explosions), but they are examined as pressure waves rather than sounds.
All Sounds Are Not Perceived Equally
The human ear is not sensitive to all sounds equally. In 1933, the results from research into how our ears perceive different frequencies was published. Researchers Fletcher and Munson released a set of human hearing sensitivity curves that are based on frequency and amplitude. The curves were created by playing a pure 1 kHz tone and a tone at a different frequency alternately. The amplitude of the 1 kHz tone was adjusted until participants felt the level of the two were equivalent. The adjustment level was recorded and they moved to another frequency.
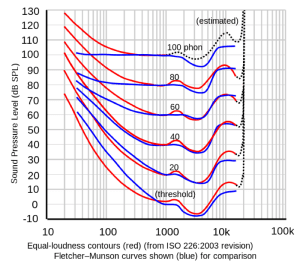
In 1937, similar testing was done by Churcher and King, but the results differed a great deal from the Fletcher Munson charts. Researchers Robinson and Dadson repeated the testing in 1956 with newer equipment. The resulting measurements were accepted and defined the ISO 226 normal equal loudness-level contours. These remained the standard until 2003 when new testing further revised the graphs.
What the curves tell us is that our hearing is most sensitive around 2 to 3 kHz, depending on amplitude. We are less sensitive to high-frequency information around 10 kHz and 150 Hz by about 20dB. We are increasingly less sensitive to sounds below 150 Hz, but this phenomenon decreases as volume increases.
How We Perceive Sound
 Many statements about sound levels get thrown around the industry. Let’s talk about and clarify a couple of the most common.
3dB is twice as loud. No. No, it isn’t. A change of 3dB represents a doubling or halving of acoustic energy. It takes an amplifier twice as much power to produce a tone at 73dB as it requires at 70dB. The reality is, most listeners can just barely perceive a change in level of 3dB at all audible frequencies.
If 3dB isn’t twice as loud, what is? Based on extensive testing, it is agreed that a change in level of 10dB is considered to be twice or half as loud.
A Listening Test
 Just for fun and education, below is a series of test tones to demonstrate our ability to detect differences in amplitude. These tests are created to make the differences as easily perceivable as possible.
The tones involve a sine wave at a frequency of 1 kHz recorded at a starting level of -10dB from the full scale in a 44.1 kHz, 16-bit uncompressed .wav file format. The amplitude (volume) of the waveform is decreased at one-, two- and three-second marks by varying amounts. For most, discerning the 1dB per step decrease is easy. Many will be able to detect the 0.5dB decrease per step. The 0.25dB decrease per step is difficult to hear.
Track 1
1 kHz, decreasing in amplitude by 1.0 dB at one-second intervals
Track 2
1 kHz decreasing in amplitude by 0.5 dB at one-second intervals
Track 3
1 kHz decreasing in amplitude by 0.25 dB at one-second intervals
Now, based on your results, does this test disprove the above statements about 3dB and 10dB differences? Not at all. As mentioned, the tests are designed to make the perception of level changes very easy. If you were to listen to a song, then play the same song again five minutes later after adjusting the volume up or down by 0.5dB or 1dB, most people wouldn’t be able to detect the difference.
We’ll revisit the decibel in future articles and explain how different rating curves affect the numbers we read when looking at audio equipment noise measurements and specifications. Until then, we hope you enjoyed this article and the test tracks.
Please check out other articles in our series on Understanding Specifications.
