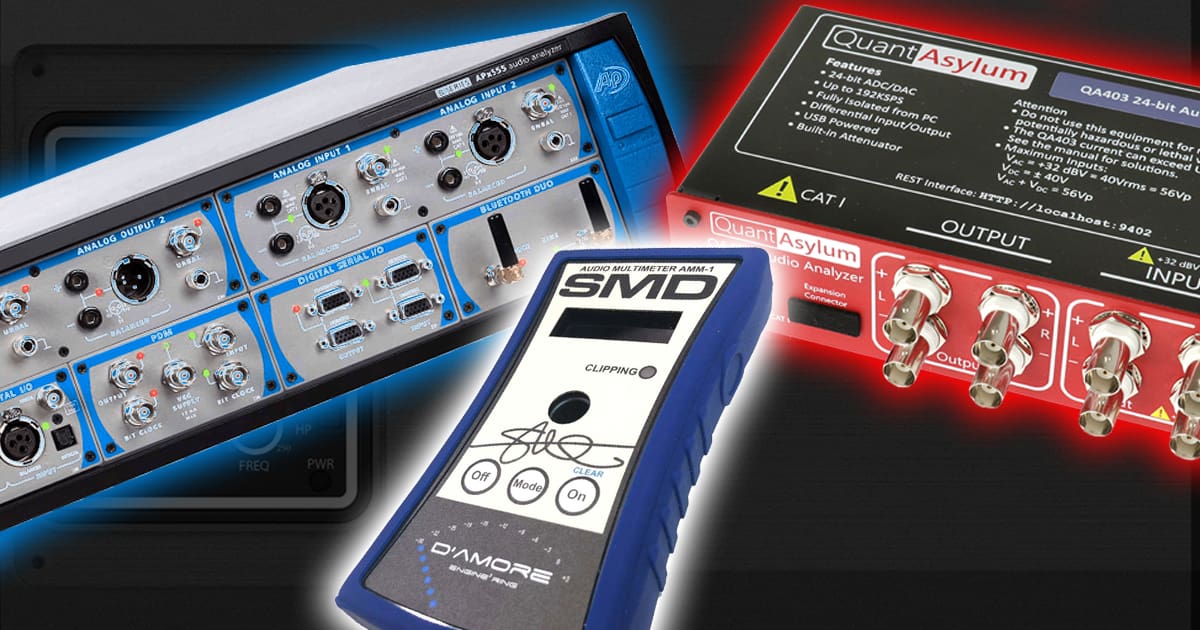
Recently, we were sent a link to a YouTube video in which someone was trying to make power measurements of a factory-installed amplifier on a motorcycle. We see videos like this all the time. Unfortunately, the numbers presented in these videos are not just inaccurate but often completely illogical. Let’s talk about how we make power measurements and what information some of the other available tools provide. The goal is to understand how we present accurate ANSI/CTA-2006-D-compliant information.
What Are Power Ratings?
Let’s start with the basics. What is an amplifier power rating? Every amplifier in the world is limited in how much power it can produce. In fact, amplifiers are rated by the maximum power they provide to a speaker or speakers. This limit is based on an output level where the amplifier distorts due to reaching a current delivery or voltage limit. We use the term clipping to describe this limit.
In every part of the audio industry, this limit is represented by the output level where the audio signal contains 1% Total Harmonic Distortion and Noise (THD+N). The idea is that 1% THD+N is an audible distortion level limit, indicating that the amplifier is no longer functioning linearly.
Distortion is measured by analyzing the harmonic content of a waveform. If the amplifier plays a 1 kHz sine wave, we consider there to be 1% THD+N when the sum of the unwanted harmonics combines to a level that is 1% of the fundamental test signal. It just so happens that 1% is -40 dBr when referenced to the test signal. Let’s look at this graphically.
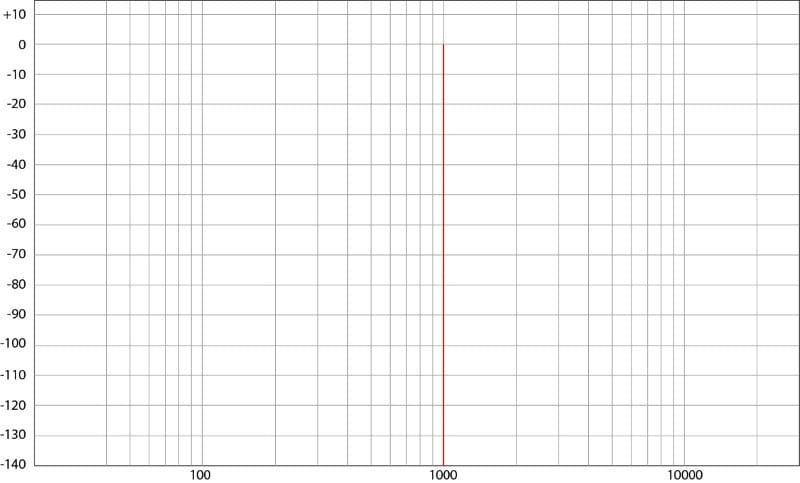
This graph shows that energy exists only at 1 kHz. It also tells us that its amplitude is 0 dBV, which is equal to 1 volt RMS.
No Amplifier is Perfect
All amplifiers add harmonic distortion to the audio signals passing through them. Here’s an example of an ARC Audio Nighthawk amp producing one watt of power into a four-ohm load. The distortion is at a mind-bogglingly low 0.00522%.
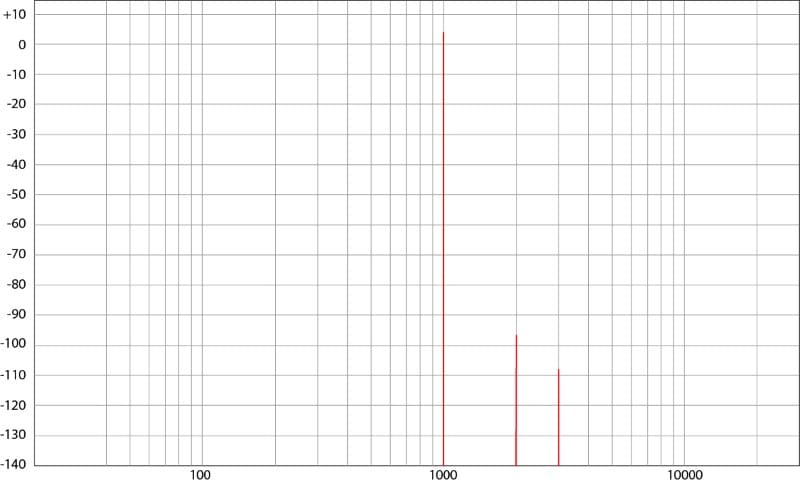
If we look at the second harmonic at 2 kHz, it has an amplitude of about -97 dBV. The third harmonic at 3 kHz is roughly -108 dBV. These add together to produce a net amplitude of -96.67 dB. The fundamental is at a level of 1.259 dBV, which is equivalent the 1-watt of power or 2 volts required per the CTA-2006-D test criteria. We get a net THD of -97.92 dB, or 0.00127% THD. The 0.00522% number specified in our Test Drive Review includes noise, which is slightly higher at some frequencies than the harmonics. Noise isn’t shown in the recreated chart above. This is a stunning performance for a high-end Class-AB amplifier. It’s even more incredible, given that this is a Class-D amp. As a side note, the discrepency between %THD and %THD+N can be significant.
Summing Harmonic Distortion
In terms of looking for the point where we decide an amplifier has reached its maximum output, we want the harmonics to be 1% of the maximum output signal. This amplifier produced 262.4 watts of power per channel into a four-ohm load. That’s equivalent to 32.391 volts or 41.64 dBV. If we make some assumptions about the harmonic content and show only the second, third and fourth harmonics, the output in the spectral domain might look like this:
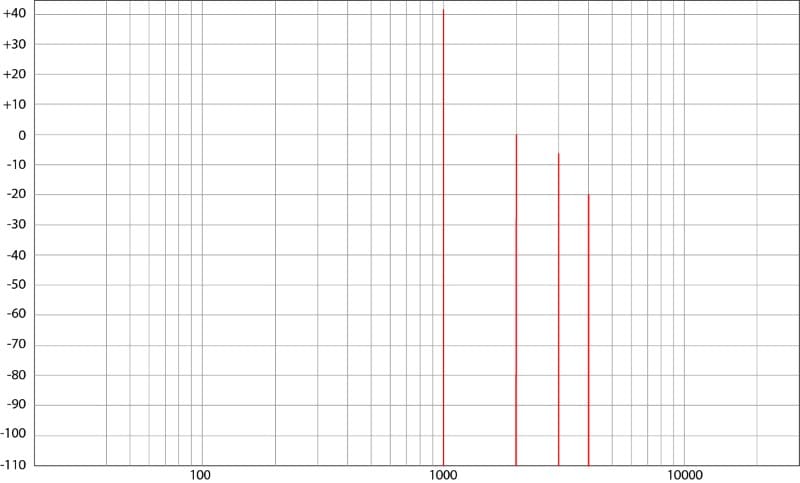
In reality, there would be many more harmonics, and the noise floor would be much higher. However, the goal here is to understand the concept of harmonic distortion and how it’s measured.
Audio Precision and Quant Asylum Analyzer Functionality
Audio Precision’s AP-series analyzers are the reference standard for audio analyzers in the audio industry. For decades, the best brands have used these analyzers in engineering and quality control applications to measure harmonic and intermodulation distortion, frequency response and output power. Unfortunately, they are expensive, at over $20,000, plus a significant yearly license fee for the software.
At a more friendly price point is the QuantAsylum QA-Series of audio analyzers. The current model, called the QA403, runs about $600 USD. We have a QA403 and QA402 on the BestCarAudio.com test bench. While these analyzers can’t handle as much voltage as the Audio Precision and don’t have as many automation routines, they are more than accurate enough to make precise measurements. These units have been our standard for many years, going back to the original QA401 model.
Harmonic Content Analysis
The AP and QA products are configurable in how they collect harmonic distortion data. The CTA-2006-D standard calls for analyzing harmonics up to 20 kHz when using a 1 kHz test tone. Their spectral output graphs, similar to those shown above, make it easy to understand the behavior of the device under test.
To measure maximum amplifier power using the ANSI/CTA-2006-D standard, the AP units generate an audio signal that increases in amplitude until the amplifier reaches an output with 1% THD+N. The software takes the measured voltage and calculates an equivalent power level for the specified test load.
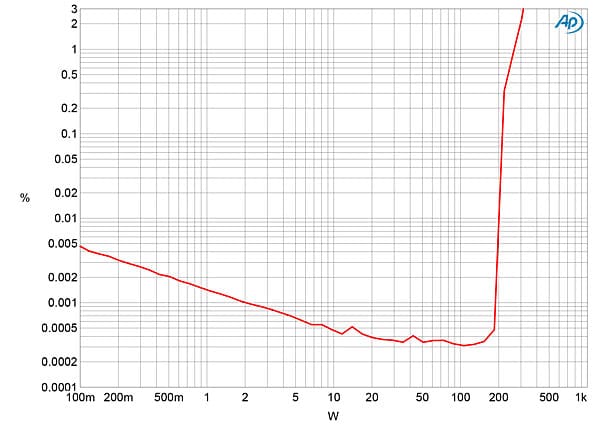
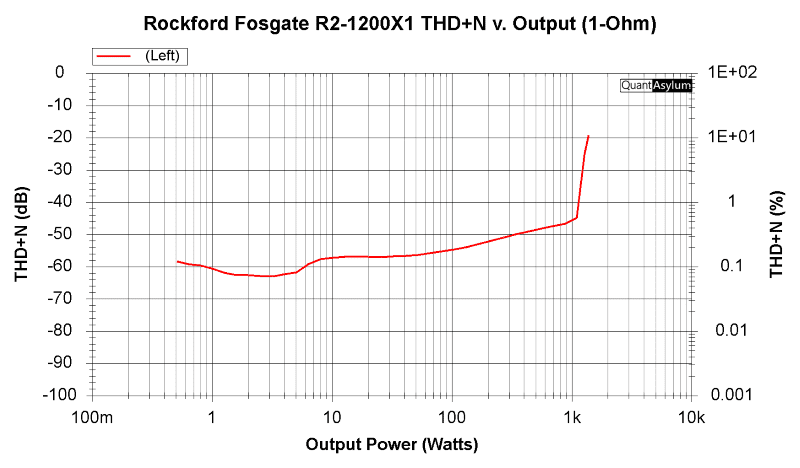
The QA units must be manually adjusted to find the output level that matches 1% THD+N. As such, each measurement takes about 10 minutes including time to ensure the power supply is providing 14.4 volts. They are also capable of creating output versus distortion graphs.
Test Conditions Matter
It’s crucial to strictly control the test conditions for measuring an amplifier. For example, our testing lab has two 15-volt power supplies capable of producing up to 100 amps of current each. We can fine-tune them to ensure the amplifiers we are testing are fed exactly 14.4 volts, per the CTA-2006-D specification. We’ll show you in another upcoming article what happens when the voltage varies.
We also have a massive bank of low-inductance ceramic load resistors and a second bank of aluminum-cased resistors for subwoofer amp measurements. The ceramic bank can handle 4800 watts of heat, and the less precise aluminum resistors can handle about 2400 watts.
Attempting to measure power output from an amplifier using speakers as a load is completely unreliable. Firstly, they are rarely a precise impedance at the specific frequency you are testing. A midrange speaker might be 3.2 ohms at 1 kHz, or a subwoofer might be 30 or 40 ohms at 50 Hz. These numbers can throw measurements off significantly in either direction, especially at impedances lower than 4 ohms, where current delivery might be a concern. No reputable company uses speakers as a load for power measurements
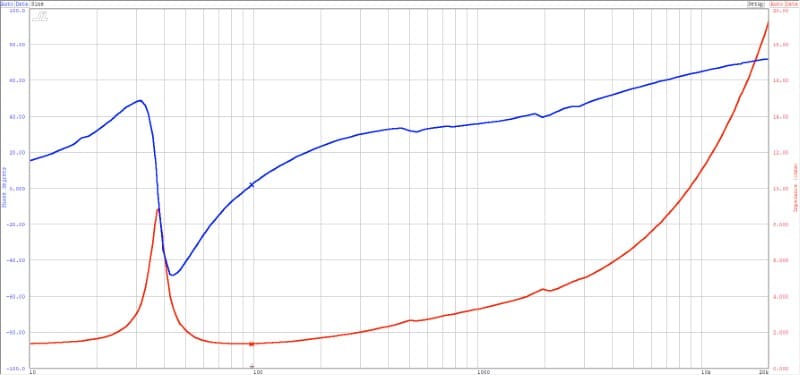
Additionally, speakers are notorious for power compression issues. While we aren’t concerned with measuring the sound output level, the reduction comes from an increase in impedance due to inadequate thermal management.
Analyzing Distortion Accurately
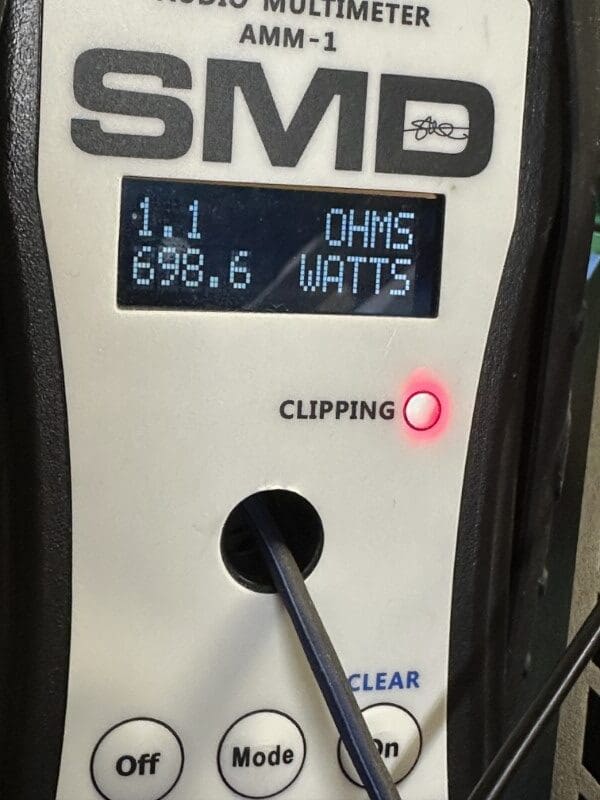
We’ve invested in several other measurement tools for the lab. Specific to this discussion, we have a pair of D’Amore Engineering AMM-1 audio multimeters. The AMM-1 is an excellent tool for making quick real-world power measurements of in-vehicle amplifiers. It can simultaneously measure the voltage at the load and current through the load and accurately calculate the power, including the phase angle between current and voltage. Speaker loads can be inductive or reactive, which changes how current and voltage interact. Using stand-alone current clamps and multimeters can’t do this.
The issue with the AMM-1 is the included Clipping indicator LED on the front panel. Many YouTubers and amateurs mistake this as a measurement of 1% THD+N. It’s not—it never was, and nobody ever said it was.
Further, the AMM-1 can’t quantify noise levels. As such, it cannot be used to determine when an amplifier has reached 1% THD+N, which is required for the ANSI/CTA-2006-D standard. Consequently, this isn’t a tool suitable for lab-grade measurements that will be presented formally.
Is the AMM-1 an excellent tool? Yes. Is it handy? Yes! Can it measure things other meters can’t? Does it replace the Audio Precision or Quant Asylum lab-grade equipment? No. Would we use them as a stand-alone power measurement solution to publish specifications? Never. With that said, we have two of them, and use them frequently when creating content.
Let’s Test a Car Audio Amplifier!
The power supplies mentioned earlier in this article are a relatively new addition to our lab. Specifically, they were the final component needed to achieve ANSI/CTA-2006-D-compliant amplifier power measurements. Previously, the output of our old supplies would drop below 14 volts with a current draw exceeding 120 amps. The power supplt upgrade has provided an opportunity to retest some products that had previously been evaluated in our lab. Therefore, we set up the Rockford Fosgate T500-1bdCP amp on the bench to redo it’s power measurements.
The amp is rated to produce 300 watts of power to a four-ohm load and 500 watts with two and one-ohm loads, when provided with 14.4-volt supply. Rockford Fosgate ensures that all product specifications meet the ANSI/CTA-2006-C standard, so we are never surprised when their products exceed the rated output.
Revisiting the Rockford Fosgate T500-1bdCP
In our original test, we measured an output of 697 watts into a one-ohm load with only 13.9 volts at the power terminals. We set up the amp again and repeated the test using the QA403 to measure THD+N, with our power supplies set to precisely 14.4 volts. With the increase in supply voltage from 13.9 to 14.4, the output power increased to 766.2 watts. This is an additional 69.2 watts, which means the amp makes more than 50% more power than it’s rated for.
Here’s what the output of the amplifier looks like on an oscilloscope.
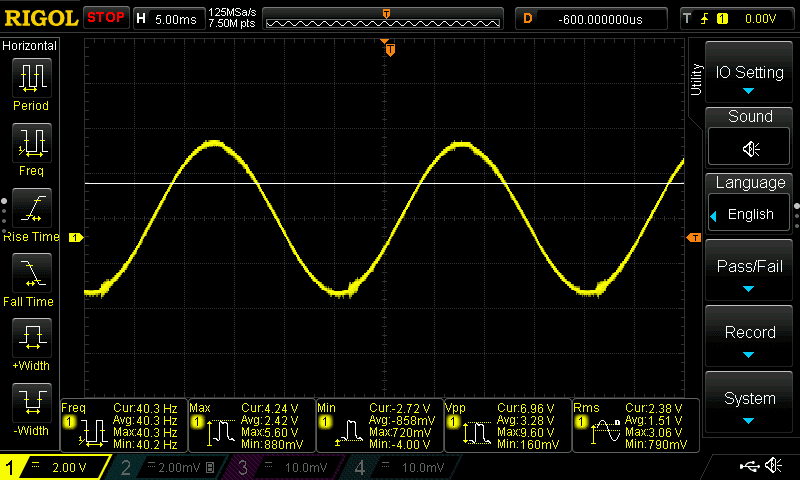
Now, let’s connect the AMM-1 to the amp and see what it says regarding power output at the same measurement. The AMM-1 confirmed our load impedance of 1 ohm and 100% purely resistive power factor. Crucially, the clipping indicator on the AMM-1 was not on when we repeated the above measurement. We increased the amp’s output until the clipping light just turned on. We moved in 0.01 dB V steps to be as accurate as possible. Here is the output waveform of the amp when the AMM-1 clipping light turns on.
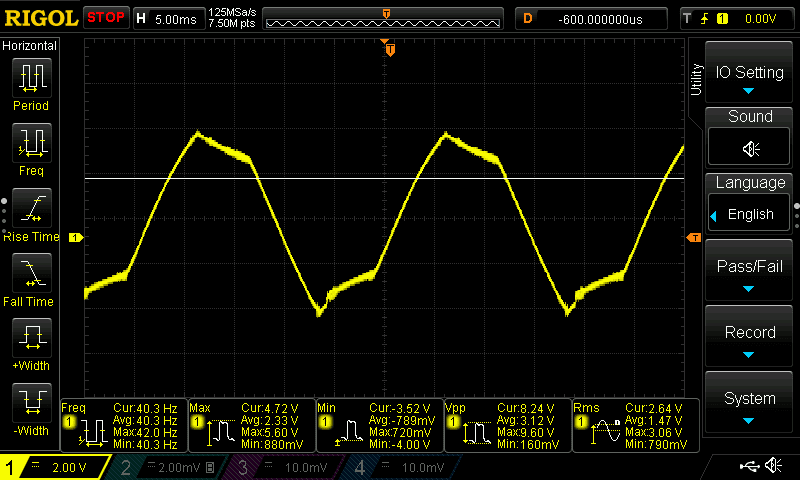
We examined this waveform using the QA403 to quantify its distortion level. The QA403 showed a THD+N of 11.02653%. Some small amplifiers, like those used in car audio source units, are sometimes measured at 10% THD+N. However, this isn’t a standard, making the associated power ratings useless.
Power Measurement Conditions Determine Accuracy
Imagine you work for a reputable automobile manufacturer. Your team is in charge of drivetrain development. The Product Planning team has asked for an internal combustion engine with a peak power rating of 300 horsepower and 250 lb-ft of torque. The Society of Automotive Engineers has created several standards, including the J1349 Engine Power Test Code – Spark Ignition and Compression Ignition – As Installed Net Power Rating, the J1995 Engine Power Test Code – Spark Ignition and Compression Ignition – Gross Power and Torque Rating and the J2723 Engine Power Test Code – Engine Power and Torque Certification to ensure the numbers your team produces are comparable to those from other manufacturers. Do you think anyone would accept data that was created using different standards?
The ANSI/CTA-2006-D Testing and Measurement Methods for In-Vehicle Audio Amplifiers is the equivalent reference in the mobile electronics industry. This document outlines all the test conditions for continuous and dynamic power ratings, signal-to-noise ratio, frequency response, maximum and minimum input signal and THD+N specifications. For published specifications to be considered indisputably valid, they should adhere to this standard.
DIY Car Audio Amp Power Measurements
We appreciate when enthusiasts take an interest in accurately measuring their car audio systems. This information is crucial for understanding system functionality and identifying areas for improvement. Furthermore, the data, when accurate, allows for product quality comparisions.
To clarify, we are not criticizing the AMM-1 or other D’Amore Engineering products. As mentioned, the AMM-1 never claimed to detect 1% THD+N. Therefore, users must understand the test conditions that affect the displayed results.
Unfortunately, a widespread lack of knowledge about how different test conditions affect measurements leads to claims that do not comply with industry standards. If you come across a post or video discussing amplifier power ratings without evidence of providing a method for accurately quantifying noise and harmonics or specifying accurate power supply voltage, the information is likely more entertainment than reliable fact. Such data is akin to comparing the technical considerations of professional wrestling to those of Formula 1 racing or launching a satellite into orbit.
