 Awhile ago, a client asked us what you get when you buy a “better” headunit. The usual answer is that you get more features and improved functionality. Those of us with a drive for the ultimate in sound quality and realism from our mobile electronics systems choose products in hopes of them receiving improved sound quality. Beyond frequency response and noise, what else makes one radio sound better than another?
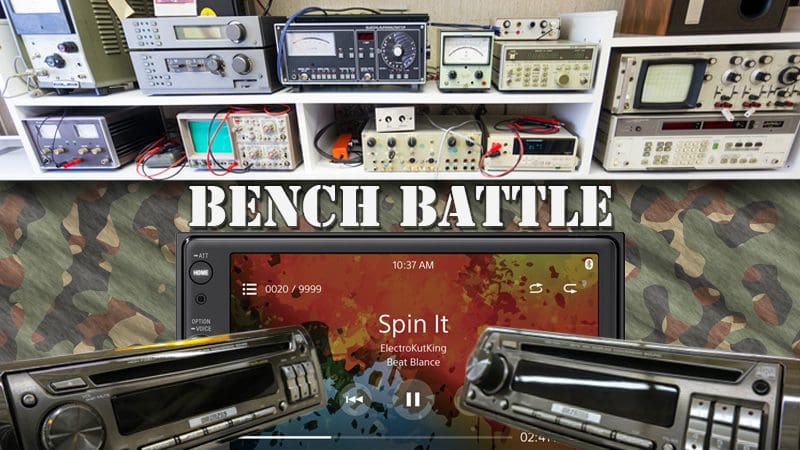
We invited two head unit specimens to the Best Car Audio test bench for a little head-to-head battle. The first subject is a modern multimedia station that is equipped with navigation, smartphone integration and the general Bluetooth goodness. The challenger is a veteran, but premium, CD receiver. It has never heard of MP3 files, doesn’t understand the concept of satellite radio and thinks Bluetooth is the result of eating blueberry pie. However, in its day, it was one of the best. We do not need to mention names here, but we will call this the bench battle of features versus performance.
The Equalizer – Premium Test Equipment
Measuring the frequency response of a car audio product is relatively easy if you can feed a known signal into the device. When it comes to measuring a signal source, that is responsible for generating the signal, so all we can do is measure the output. We have a high-end digital interface on our bench. It offers a flat frequency response from 5 Hz to 92 kHz with a tolerance of 1 dB. The signal to noise ratio is an amazing 116 dBA and distortion is specified at less than 0.00032%. These specifications exceed those of both source units we are going to test.
Frequency Response Measurement
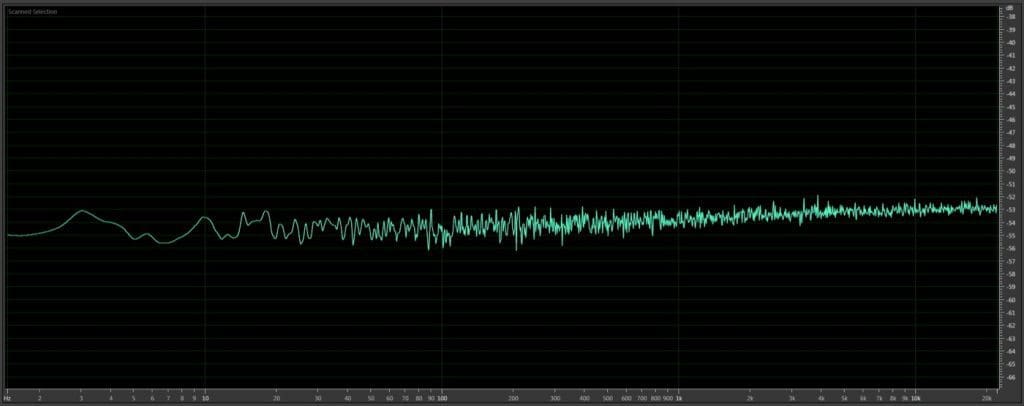
Testing the frequency response of a source unit requires some trickery. We have developed a reliable method that has proven itself time after time. The image below shows the frequency response of the reference signal. It has a slight incline in the high-frequency region, but everything is within a tolerance of about 1 dB. We converted this 192 kHz, 24-bit test track down to the CD standard of 44.1 kHz and 16 bit. Response to 22.05 kHz remains ruler-flat.
Frequency Response Results
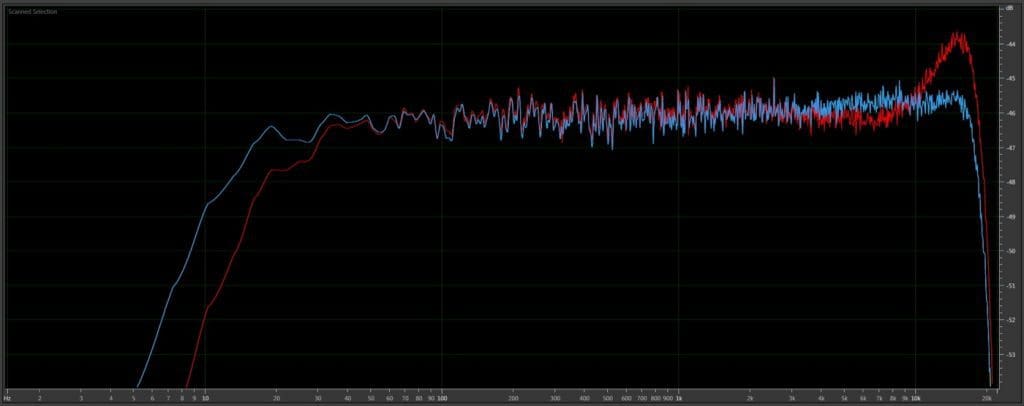
Before we get into the results, we want to explain how to use the measurement graphs. The test track uses random noise as part of the test procedure. We process that after the test is complete. What you want to observe is the trend of the charts. A small peak or valley is not an anomaly in this scenario. Average the curve in your mind to see the overall trend.
The CD receiver: We played our test track from a standard CD audio file to make sure both source units were given the same information. The frequency response of the unit showed a typical response. The high-frequency filter kicks in around 17 kHz, which is normal for consumer products.
The DVD receiver: We played the same CD in the DVD receiver to see how it responded. The manufacturer of the DVD receiver has included a 2 dB boost on the top end that starts at 7 kHz and peaks at just over 2 dB at 15 kHz. The high-frequency filter response is similar to that of the CD player.
The high-frequency boost is not a big deal in terms of how a system sounds. Most of us have some high-frequency attenuation in our hearing, so this helps put some of the sizzle and air back into our music. It would be worth checking whether the source unit output clips when a 0 dB 15 kHz tone is played. This article is not a product review, so we will save that for someone else to tackle.
Bring the Noise
Our next challenge for the new versus old shootout is a little more technical: We wanted to see how each unit performed regarding background noise. This test is often reserved for lab environments, but can quantify the effort put into the component selection and system design.
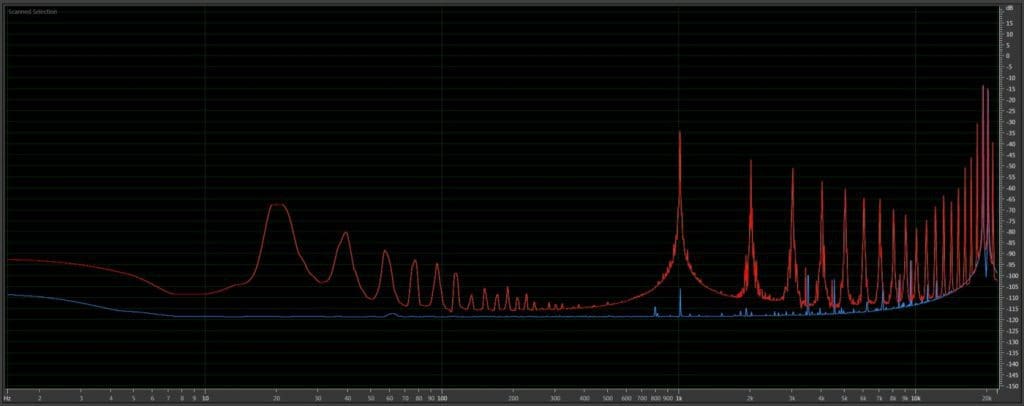
For this test, we used a 1 kHz test tone recorded at -90 dB relative to full scale. Because the two source units have different pre-amp capabilities, we adjusted them so the output of the 1 kHz tone was equal in amplitude. This would best depict the noise imposed on the signal.
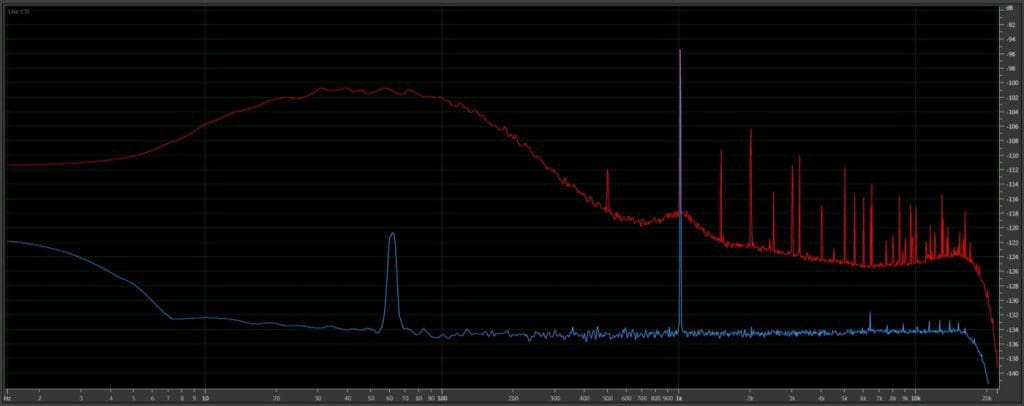
The CD receiver: We can see that the background noise relative to the signal is very quiet. There is a little bump at 60 Hz that was created by the power supply on our test bench. Otherwise, the test was impressive.
The DVD receiver: The background noise relative to the 1 kHz is 10 to 15 dB louder than that of the CD receiver at higher frequencies. There are also some spurious harmonic distortions in the output signal, mostly above 1 kHz. The large bump in noise in the low-frequency region could be caused by our 60 Hz 120 volt power supply causing some harmonics. The bandwidth is really wide, so it is hard to determine for sure.
A Distorted Perspective
We decided to repeat the test with a full-amplitude 1 kHz sine wave to see what harmonic content would be created at higher internal levels. The limits of the FFT analysis in our software starts to show up here. The flat horizontal line on the left of the chart and the angled line on the right are due to the analysis software and don’t represent noise.
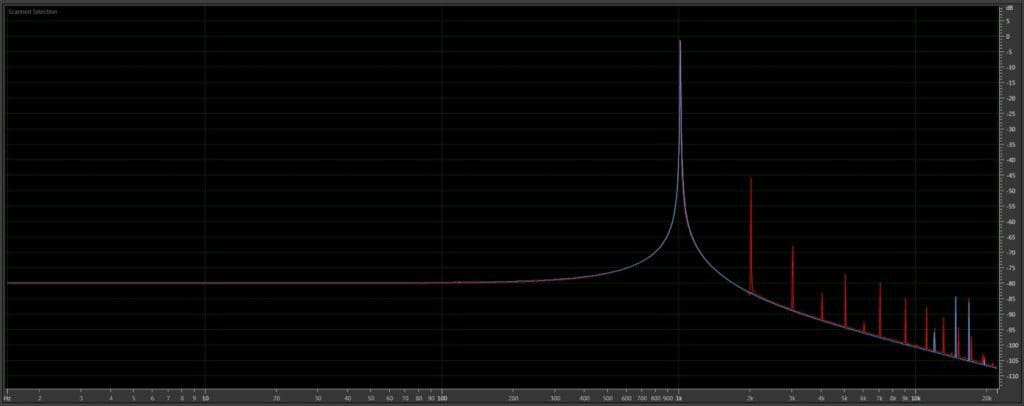
The CD receiver: We noted two small harmonics at 14,750 and 165,000 Hz, with a slight harmonic at 12,000 Hz. Otherwise, the signal was very pure.
The DVD receiver: Harmonic distortion was clearly present at 1 kHz intervals starting at 2 kHz. It is worth noting that the first resonance is 45 dB quieter than the reference signal. If you were just playing the test tone, you might be able to hear it, but only just barely.
The Grand Finale – Intermodulation Distortion
Testing for intermodulation distortion is, well, mean. Out intermodulation distortion test is comprised of a CD test tone with 19 and 20 kHz sine waves played simultaneously. The spectral response of the test track can be seen below.
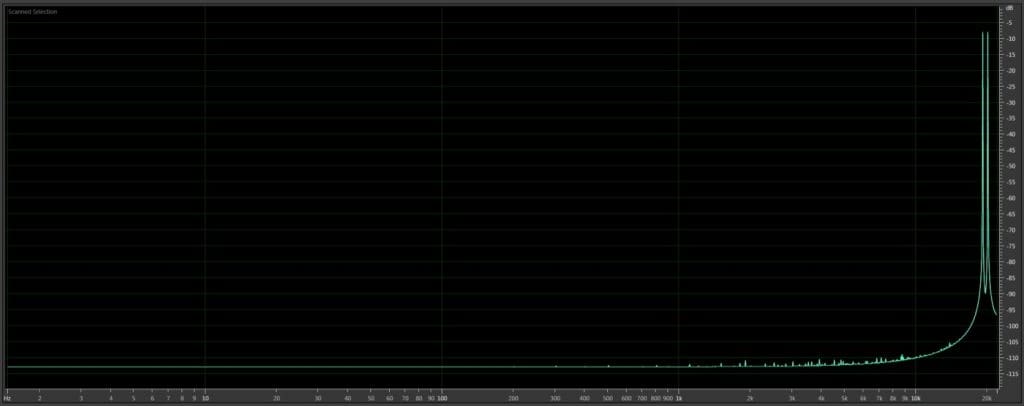
The CD receiver: When you are looking at an intermodulation comparison test, you are looking for frequency content that wasn’t in the original file. In the case of the CD receiver, we can see a very small bump at 1 kHz. This is significant because it is the difference between 19 kHz and 20 kHz. This would be considered an excellent result. A few other spikes show up at 3,500, 4,500 and 9,500 Hz, but they are still quite low – peaking at -93 dB relative to the test signal level of –15 dB.
The DVD receiver: We cannot really explain what happened here. There is 1 kHz content only 20 dB down from the 19k Hz and 20 kHz tones. Then harmonics upon harmonics of this up to 21 kHz. This test shows why some source units sound accurate and pure, while others do not.
Are Headunit Features Worth the Trade-off?
A few months ago, we published an article about harmonic distortion. That served to establish the basic understanding of how distortion creates content that wasn’t present in an original audio file. Our intent in this comparison is not to put down the modern DVD receiver, but to show what happens when manufacturers forego the bells and whistles and simply focus on all-out performance.
The same tests that apply to these source units are also common in amplifiers and speakers. We will subject an amplifier to the same mean and nasty tests in the coming months.
Don’t ever let price, perception or age dictate how you think a product sounds. Work with your mobile electronics specialist retailer to listen and compare for yourself. You will be amazed at what you hear.

Leave a Reply