As happens frequently, a friend tagged me in a social media post about someone comparing two subwoofers using free enclosure simulation software. This person had spent significant time modeling different drivers in different air volumes and tuning frequencies to devise a solution for their vehicle. Unfortunately, aside from not considering how the vehicle would affect the subwoofer’s response, they’d also made a grave error based on the graphs they were looking at. Let me explain what happened.
Subwoofer Frequency Response Simulations
We should start by looking at what enclosure simulation software does. All speakers act like springs. The voice coil pushes the speaker forward, then the spider and surround pull the speaker back to rest. If the speaker is in an enclosure, the air inside that enclosure contributes to the spring, limiting how far the speaker moves for a given force from the voice coil. The contribution of the air in the enclosure can be beneficial and detrimental, even simultaneously! For example, a small amount of air in the enclosure acts like a tight spring, dramatically limiting how far the cone moves. Since speakers need to move much more to reproduce low-frequency information, the enclosure acts like a high-pass filter. The “tight spring” effect can also increase output from the speaker. Though it’s mostly distortion, the speaker cone continues to move after the signal goes away. This added cone movement adds acoustic output. Sadly, it’s not audio content that was in the original recording.
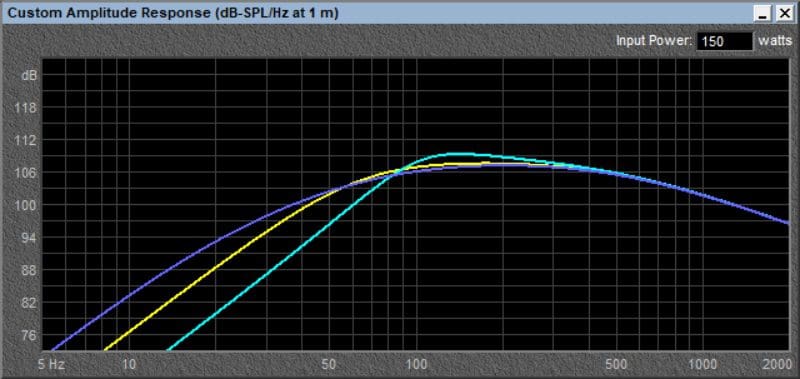
The graph above shows the predicted frequency response of an 8-inch subwoofer in three different enclosures. The yellow trace indicates the subwoofer’s output when it’s in an enclosure with 0.3 cubic foot of airspace. The teal trace is the predicted output when the subwoofer is in 0.1 cubic foot of space. Finally, the violet trace is the expected output when the sub has 1.0 cubic foot of air behind it. Of course, the three enclosures would sound very different, and the driver would have different power handling limits in each application.
Normalized Response Curves
When designing speaker enclosures, a half-dozen characteristics must be balanced to determine what is right for a specific application. In the case of the discussion I was asked to comment on, the person doing the simulations chose a particular driver and enclosure design based on the predicted output of the system. Unfortunately, he was looking at the wrong type of graph and chose incorrectly based on his goals.
Speaker enclosure simulation software provides graphs in two common ways: They show either normalized response or amplitude/acoustic/SPL response. The shape of the curves in both graphs will be the same for each simulation. However, the amplitude of multiple simulations will vary based on the physical characteristics of the drivers being modeled. I’ve created a comparison to show how the information is easily misinterpreted.
In a normalized response graph, simulation software will show you the gain or loss in output based on the enclosure and perhaps the inductive effects of the voice coil relative to what the speaker would produce based purely on a calculated efficiency. I know that was a mouthful. So let’s look at a graph to understand this a bit better.
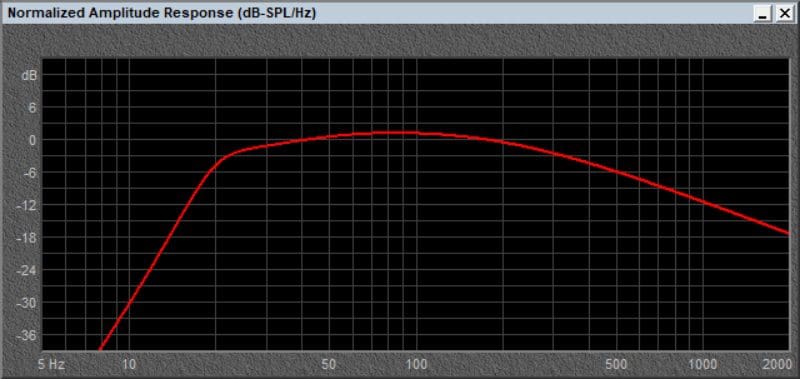
The graph shows us several pieces of information. First and foremost, the shape of the red trace indicates how loud the subwoofer is at different frequencies ranging from 8 hertz to 2 kHz, assuming it’s provided the same voltage at each frequency. If you have any filters or equalization applied, the predicted output will vary. Second, the graph shows us that this enclosure design has increased the driver’s efficiency over its calculated level from about 45 hertz to 160 hertz. This design adds 1.13 dB of output at 83 hertz. Next, we can see that the system’s output decreases quickly and dramatically below the enclosure tuning frequency of 22 hertz. Typically, when modeling subwoofers, we look at the -3 dB frequency and the 10 dB level to understand how much deep bass will be produced. This enclosure has a -3 dB frequency at 22 Hz and is down 10 dB at 17 hertz.
Now, let’s make a comparison. I’ve added a second trace to the graph. It’s a very different subwoofer than what created the red trace.
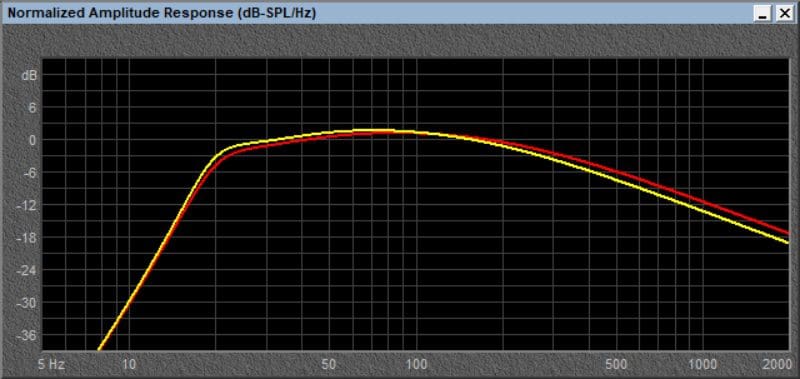
Looking at this graph, we can see that the software predicts that the second subwoofer will be more efficient at almost all frequencies under 100 hertz. The difference is about 1 dB SPL at 25 hertz, so the difference isn’t drastic. However, because we are looking at a normalized graph and not an amplitude response graph, the statement that the second subwoofer is louder is actually completely incorrect.
As I mentioned, these normalized graphs show the enclosure’s effect on the driver’s output relative to its calculated efficiency. For example, the subwoofer represented by the red trace has an efficiency of 87.34 dB SPL @ 1W/1M. The subwoofer represented by the yellow trace has a calculated efficiency of 85.72 dB SPL. The gains and losses shown on the graph are relative to those efficiency numbers. To decide which is louder, we must simulate power going to each subwoofer.
SPL Response Graphs
Let’s tell the software we will provide each subwoofer with 100 watts of power, then ask it to predict the output.
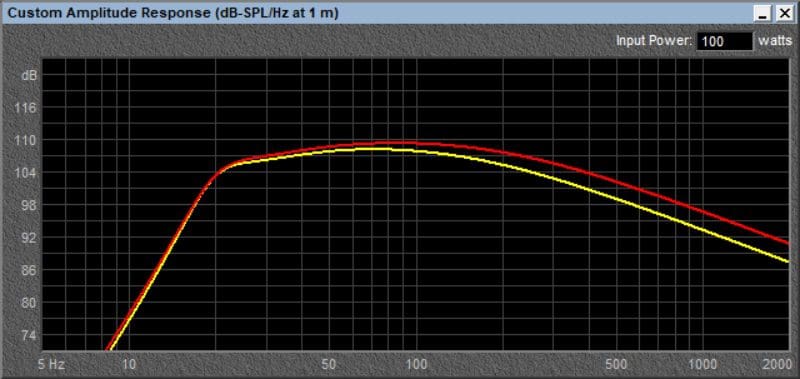
We can see that the shape of each trace is the same, but the red trace is now above the yellow almost everywhere above 22 hertz. This change makes sense, as the subwoofer represented by the red trace is several decibels more efficient. This also stands to reason, as the subwoofer represented by the red trace is a 16-inch driver, and the yellow one is a 12-inch.
Power Not Voltage
One other consideration: Many engineers who develop speakers work with voltages rather than power. The behind-the-scenes calculations that create the graphs are all based on voltages. If the software you’re looking at uses voltages, the impedance of the drivers matters a great deal. Applying 2 volts to a 1-ohm subwoofer results in 4 watts driving the subwoofer. Only 1 watt is produced if we use 2 volts to a 4-ohm subwoofer. Making observations without taking power rather than voltage into account can skew the perceived results significantly.
Leave the Subwoofer Enclosure Designs to the Experts
If you want a subwoofer enclosure designed for your vehicle, visit a specialty mobile enhancement retailer near you. They can provide you with a bass solution that will look and sound great and blend nicely with your vehicle’s interior. If they show you any response graphs, make sure you’re looking at the correct type of graph before making decisions based on output capability.
