Expert installation technicians in the car audio industry are fortunate to have several options to simulate speaker and subwoofer response in different applications. Whether it’s modeling a bass reflex enclosure for a pair of 12-inch subwoofers or ensuring that an A-pillar speaker pod is large enough for a 4-inch midrange, computer simulations are crucial to delivering car audio systems that sound great and function reliably. A common misconception with software like Leap, TermPro, BassBox Pro or WinISD is that they predict sound quality. Let’s take a close look at this topic.
Speaker and Subwoofer Response Software
Enclosure simulation software exists to assist in predicting the frequency response and excursion-based power handling limits of a speaker when it’s placed in an enclosure. The software uses a set of specifications for the driver in question called Thiele/Small parameters. These parameters describe the mechanical and electrical properties of a speaker that affect its low-frequency performance.
Speakers, especially woofers and subwoofers, require enclosures for several reasons. An enclosure acts as a high-pass filter that reduces the output of a speaker at extremely low frequencies to protect it from damage from over-excursion. Of equal importance, the enclosure manages the sound coming from the rear of the speaker so that it doesn’t mix with the sound coming from the front. If the two sound sources are allowed to combine, they cancel each other. Enclosure designs such as bass reflex (ported or vented) or passive radiator can boost low-frequency output to increase the system’s efficiency.
Subwoofer Simulation Software Frequency Response Prediction
Assuming your installer can acquire accurate Thiele/Small parameters for the speakers or subwoofers you want to use in your vehicle, they can use simulation software to predict their low-frequency performance. The best application for this software is to predict what subwoofers will work best for a given application.
The simulations below are for a 1.8-cubic-foot enclosure designed to fit under the rear seat of a pickup truck. The red trace predicts the output of four 10-inch Rockford Fosgate T1S1-10 slim subwoofers with the enclosure sealed. The yellow trace shows a single T1S1-10 in the same enclosure with a vent tuned to 35 hertz.
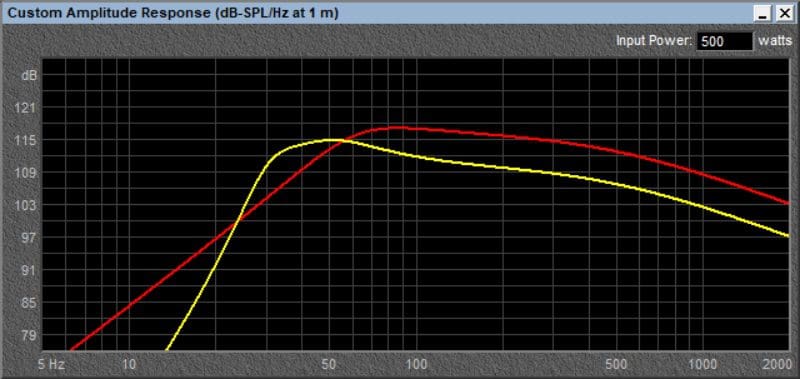
As you can see, if you want the most low-frequency performance possible from this enclosure, the single driver in a vented design is significantly louder at all frequencies below 55 hertz. It would also cost a fraction of what four drivers would.
Can Simulation Software Predict Sound Quality?
A common misconception is that the sound quality or accuracy of an application can be predicted by low-frequency simulations. Depending on how you look at the information, this can be true or false.
If you look at the graph below, you’ll see a simulation of an 8-inch subwoofer that was crammed into a 0.106-cubic-foot enclosure for the footwell of an exotic car.
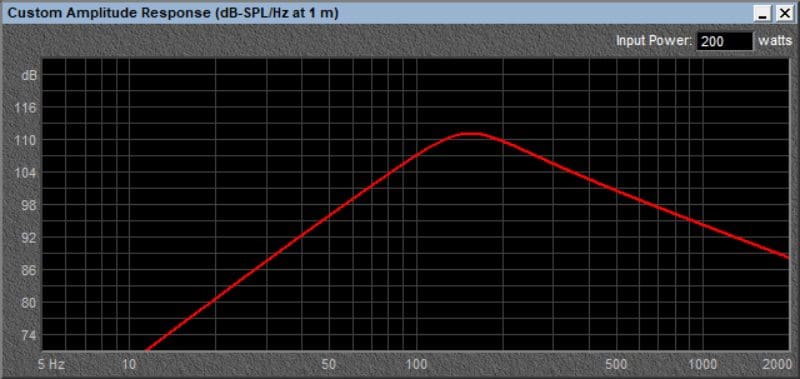
As you can see, this driver doesn’t act like a subwoofer at all. In fact, it barely passes as a midbass driver. It really needs an enclosure that’s three times as large, and even then, it doesn’t produce significant amounts of low-frequency output. Using this driver in the application of a subwoofer would indeed sound pretty bad.
Enclosure simulation software is also an ideal tool for modeling midrange drivers that are to be installed in A-pillar speaker pods. If the enclosure is too small, there will be an unwanted resonance in lower midrange frequencies that will detract from the accuracy and enjoyment of the speaker.
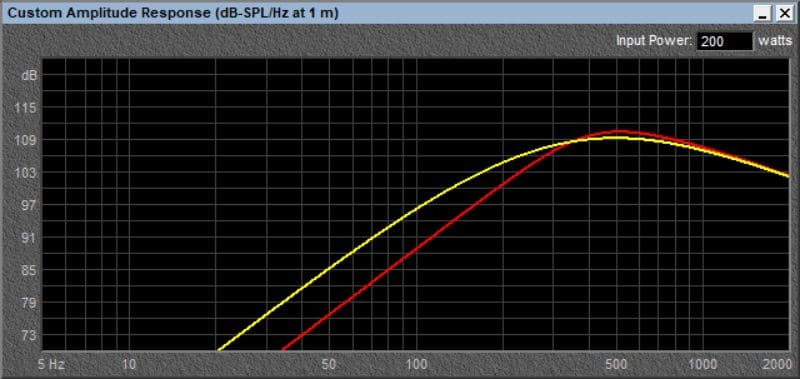
The bump at 500 hertz shown in the red 0.1-cubic-foot trace would be very annoying. An equalizer can be used to reduce the amplitude of the resonance, but it can’t reduce the associated distortion.
Enclosure Simulation Software and Speaker Distortion
Over the last few months, I’ve published several articles that quantify speaker distortion at different output levels. If there is a resonance in the cone, dust cap or surround, enclosure simulation software can’t predict that.
I can only think of one car audio company that has published distortion data on its speakers.
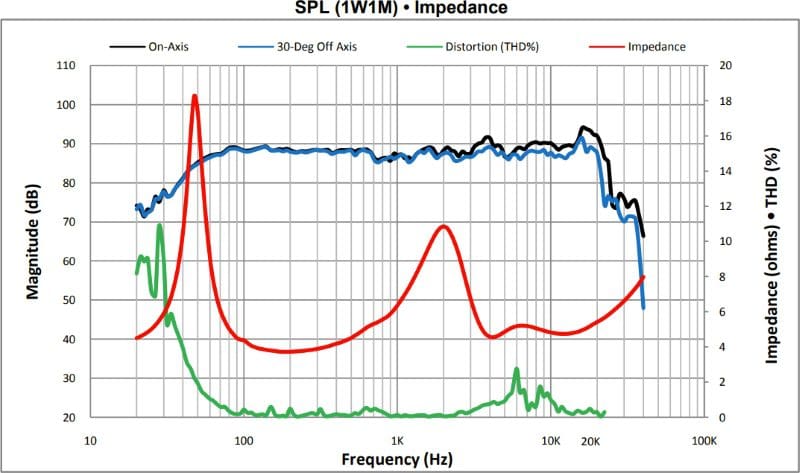
The graph above shows the frequency response of a very high-quality 6.5-inch two-way component speaker system. The black trace depicts the response at 1 meter measured on-axis with the speakers. The blue trace shows the response at 30 degrees off-axis to the speakers. The red trace is the impedance of the speaker system. Finally, the green trace shows the system distortion at different frequencies.
The graph below predicts the output of the 6.5-inch woofer from the set above in a 3.5-cubic-foot enclosure. This is very similar to what would be found with the speaker mounted in the door of the average car or truck.
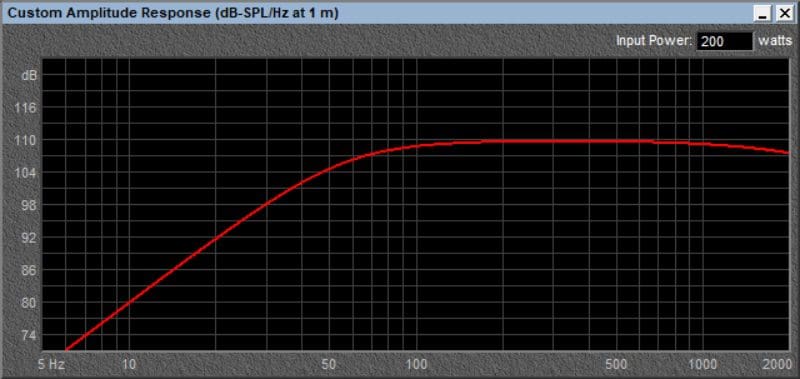
Now to compare the information. The small dip in the response above 700 hertz isn’t presented in the graph. This is a perfect example of how these simulations don’t predict sound quality, only low-frequency performance related to the interaction of the transducer with the enclosure.
Speaker Non-Linearities
While these enclosure simulation programs can predict cone excursion at different drive levels, they can not indicate when the speaker will become nonlinear. At low power levels, nonlinearities in motor design and suspension aren’t a significant issue in sound quality. When a speaker, in particular, a woofer or subwoofer cone, starts to move significantly, these issues become a problem. If a speaker uses a linear spider, the opposition to the magnetic force from the voice coil increases with excursion. This leads to the waveform created by the speaker not matching that of the input signal. If the strength of the magnetic field changes over the range of cone excursion, the same thing happens.
When the output waveform doesn’t match that of the audio signal, distortion is added. Think of a square wave. It’s simply a sine wave with an infinite number of second-order harmonics added to it.
Enclosure simulation software can’t describe or predict the unwanted harmonic information added to the output of a speaker or subwoofer. You could model an inexpensive speaker with a linear spider and no distortion-reducing technologies and compare it to a high-end speaker with a shorting ring, copper voice coil cap and a progressive spider and get the same response curve.
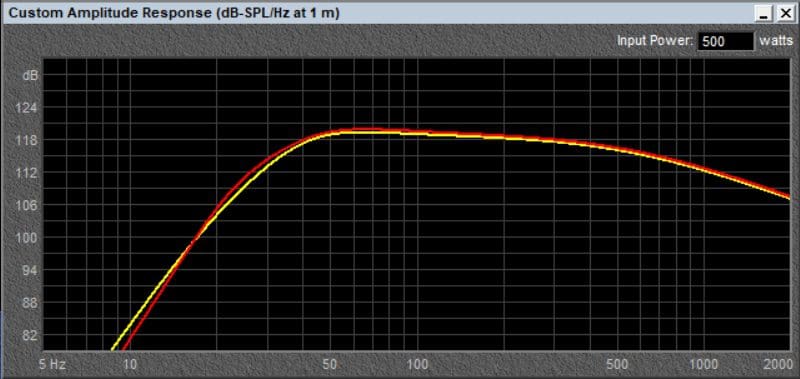
The graph above shows the output of two very different subwoofers. One is a very affordable entry-level driver (in yellow), and the other is an audiophile-grade solution replete with distortion-reducing features. Aside from the 0.5 dB difference in output, the predicted response curves are nearly identical. However, in listening to the drivers, the better driver offers significantly less localization because of a dramatic reduction in harmonic distortion.
Shop with Your Ears, Not Your Eyes
When it comes time to choose a subwoofer for your car or truck, drop by a local specialty mobile enhancement retailer and audition options that will provide excellent low-frequency extension in the space you have available. The shop can use enclosure simulation software to help decide what size subwoofer or subwoofers will work best in your application.
