
I was recently rewatching the YouTube video from GoldenSound about how he tested the quality of the MQA file format by uploading several test tones and part of a song to Tidal. His results showed without any shadow of a doubt that the MQA format didn’t meet many of the claims made by the company. This article isn’t about MQA, thankfully.
I’ve often wondered about the quality of YouTube audio. Many musical artists share their music videos on YouTube. Does uploading music to YouTube ruin it like MQA ruins it on Tidal? Let’s find out!
The Test YouTube Audio Process
Ensuring that any test you perform is repeatable, accurate and relevant in delivering the information you want is crucial. So I wanted to eliminate as many variables as possible. I created a test track that we’ll examine in the next section. I also decided I didn’t want to measure an analog audio output from a computer, as the analog circuitry can play a massive role in what we’d observe. Some quick googling showed that we can set Windows to capture audio internally by enabling Stereo Mix as a source.
To ensure that the test is apples to apples, we played our test track directly within the computer, then uploaded it to YouTube and re-recorded it. This should let us see the differences between the original file and the YouTube download. That’s the information we’re after.
The Test Track
We don’t need to get crazy scientific with this test. The three things we want to know about are frequency response, distortion and noise. I created a test track that starts with two impulse responses. Using impulse response data is common when evaluating D/A and A/D converters and the performance of digital filters. Many car audio installers use them to check the polarity of audio signals sent to a speaker. In our case, we want to know if the microscopic blips are butchered or remain reasonably clean. They sound like a slight ticking sound.
Impulse Response Test
An impulse response is one bit of data that’s shifted high. Our impulse test sample was created at a sampling rate of 44.1 kHz. I’m making all the measurements at 192 kHz to capture as much resolution as possible.
If this were perfect, we’d see a flat line at the 0-dB level, a single sample that goes to 100%, and a flat line again. The bouncing up and down you see before the spike is pre-ringing, and the post-ringing is after.
The next test track is a square wave. I created this waveform in Adobe Audition at a frequency of 10 hertz. This test is another way to evaluate spectral performance, but it can also show ringing, as we saw in the impulse test.
Frequency Response Tests
The next test section is white noise. White noise contains random audio frequencies that are all at the same amplitude. When we average a white noise measurement over a few seconds, it’s easy to evaluate the frequency response of a system in the electrical domain.
I followed this with pink noise. Pink noise is similar to white noise, containing random audio information across the entire audio spectrum. It differs because the amplitude of information attenuates at a rate of 10 dB per octave above 20 hertz as frequency increases. Pink noise is used for acoustic measurements as it represents how we hear. With pink noise, we’d perceive (in general terms) that 10 kHz was as loud as 100 Hz. Pink noise appears as a flat horizontal line on an audio analyzer (RTA).
Next, I added a frequency sweep that starts at 20 hertz and goes up to 96 kHz. There are frequency response limitations when encoding audio, so this track will clarify where any high-frequency limits exist.
Distortion Tests
Next, we have a 1-kHz test tone. This is a single-frequency tone that is usually recorded at a high level. We can use this tone to evaluate how systems add harmonic distortion to audio information. If we get more than 1 kHz out of a device, it has added harmonic distortion. I use a tone recorded at 0 dB FS in most tests. This is the highest recording level possible in the digital domain. However, I lowered this test to -1 dB as I saw clipped samples in the waveform.
I added two more 1-kHz tones. The second pure tone is recorded at -60 dB FS, and the third at -90 dB FS. These will be used to look at how the system adds noise.
The next tones are a common way to measure intermodulation distortion. The test includes simultaneous 19- and 20-kHz tones recorded at -7-dB FS levels. You should ideally get only 19- and 20-kHz information when played back through a high-quality system. However, many systems add lower side-band distortion at 15, 16, 17 and 18 kHz and upper side-band harmonics at 21, 22, 23 and 24 kHz. There is also the potential for a “product” to be created at 1 kHz. One kilohertz is the difference between 19 and 20 kHz in the original file.
Video Encoding and YouTube Processing Results
We’re going to show two images for each of the tests. The first will be the loopback test that shows what the creation of the video file did to our ideal test tracks. The second will indicate what uploading that video file to YouTube did. To be clear, I’m uploading a video file that contains a still image and the WAV audio test file I’ve described above.
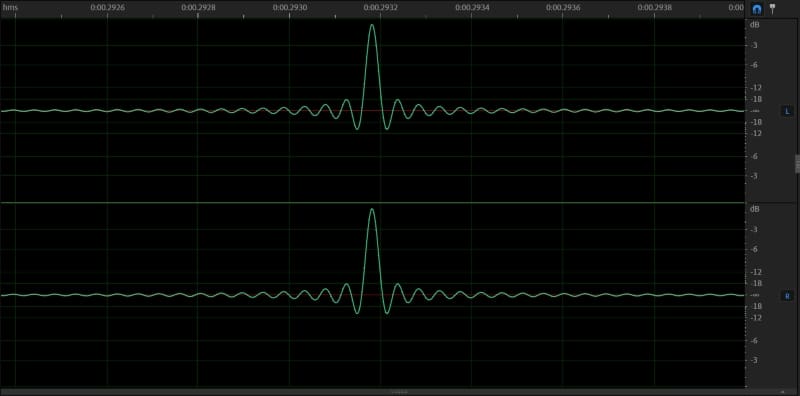
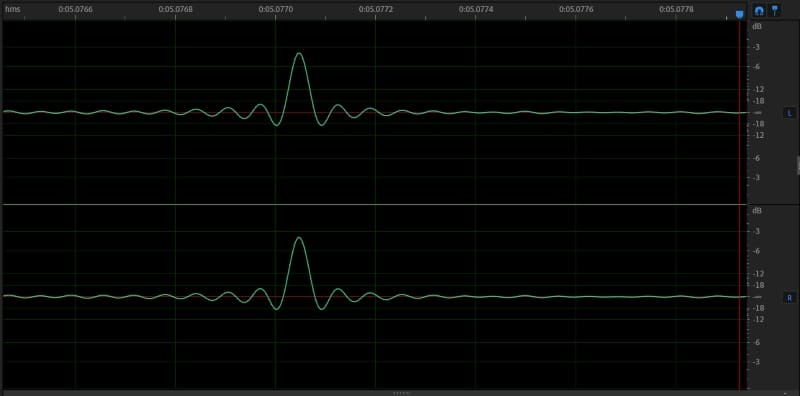
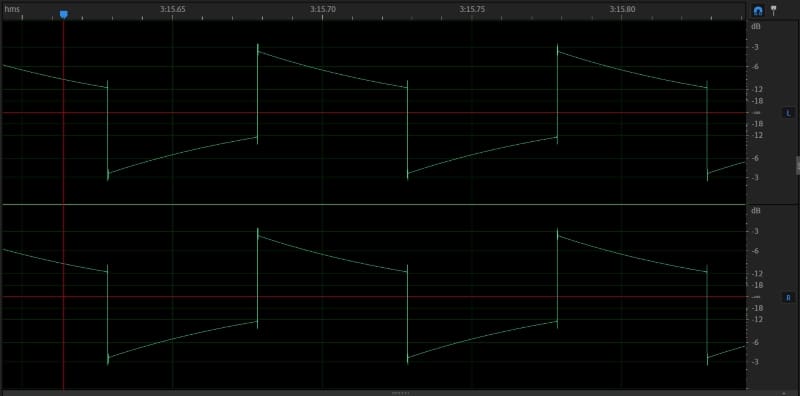
So, let’s start reviewing the results with the impulse response track. Here’s what the file I uploaded to YouTube looked like.
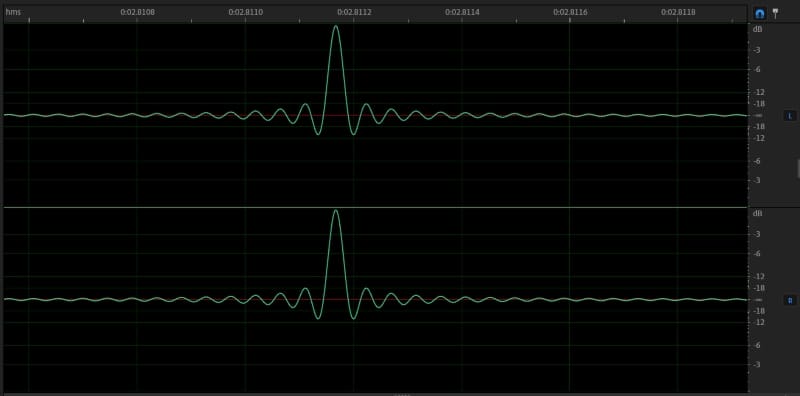
Looking at the image below, we can see that we lost some amplitude. I’ve checked to ensure that other waveforms, like the 1-kHz tone, for example, are at the same amplitude as the original and within a few tenths of a decibel. Based on this test, there doesn’t appear to be a significant increase in pre- or post-ringing. We’ll take that as a good thing.
When we rendered the video in Adobe Audition, we set the audio to MPEG-1 Layer-II with a bitrate of 384 kbps. This setting was the “best” option I had available. In short, video container files such as H.264 or MPEG-4 must balance audio and video quality. There might be more exotic options, but this was the best I could get with the available tools.
The square wave test will be the next technical evaluation. The image below shows added pre- and post-ringing at the leading edge of the square wave transition.
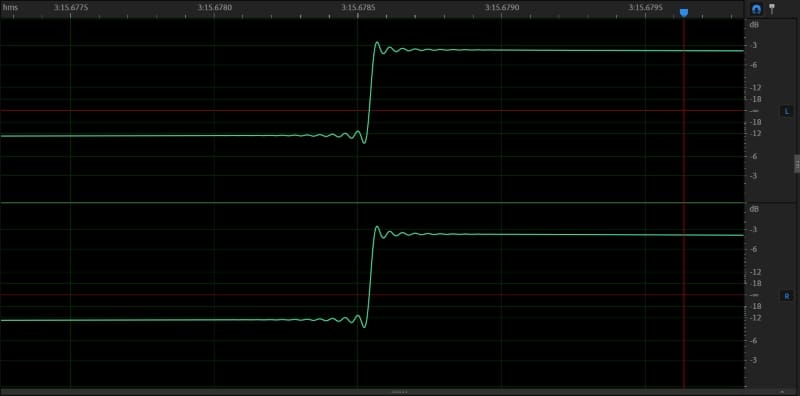
Significant oscillations occur in the pre- and post-ringing areas after the transition.
The slope of the waveform has also changed because of the frequency response limitations imposed when creating the test file and additional attenuation from YouTube’s compression.
Now, let’s look at the overall shape of the waveform. YouTube did its thing again and messed things up.
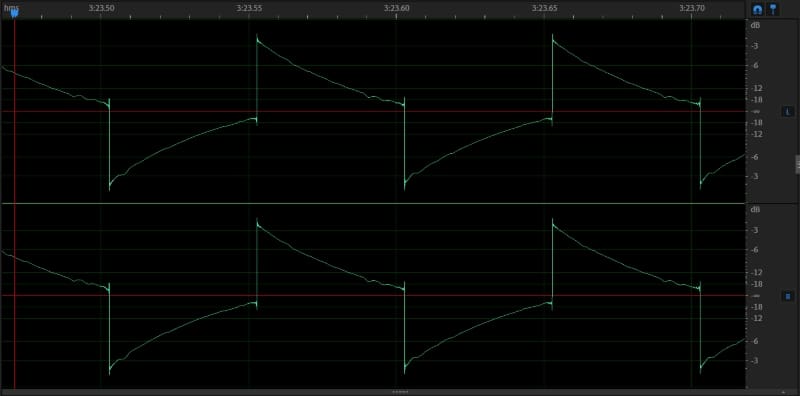
Initially, I had no explanation for the wavering of the waveform trace between the positive-to-negative transitions. A direct comparison of this region’s before and after frequency content revealed the answer. Aside from the high-frequency bandwidth limitation, the dynamic range compression filled in the bottoms of the waveforms. In essence, YouTube added unwanted audio content between the square wave harmonics. Neat! It’s not good, but it’s interesting to see what occurred.
YouTube Frequency Response Results
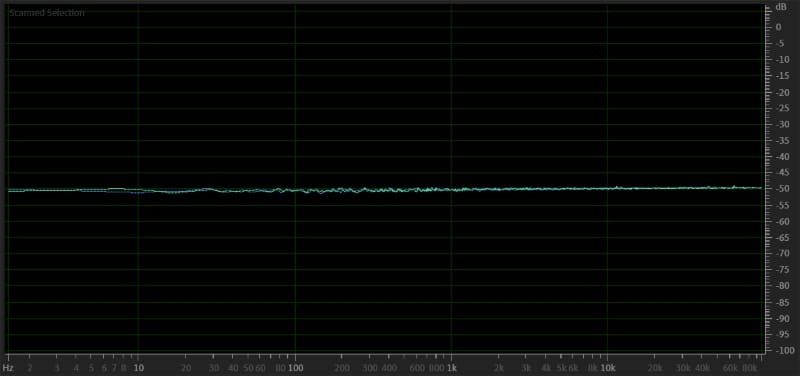
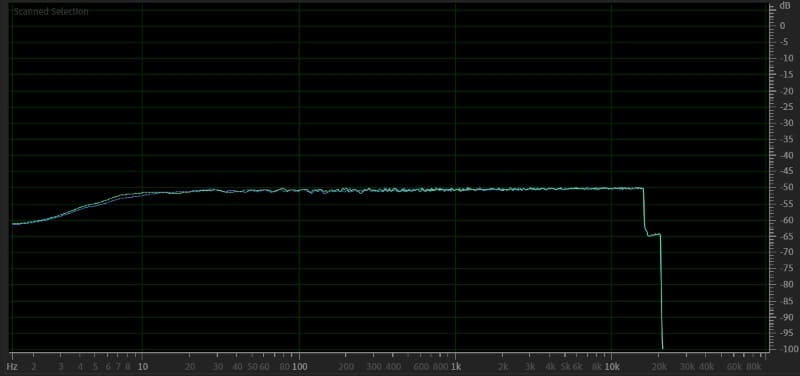
Examining this track will instantly tell us what YouTube might be doing to the frequency response of the audio in a video uploaded to it.
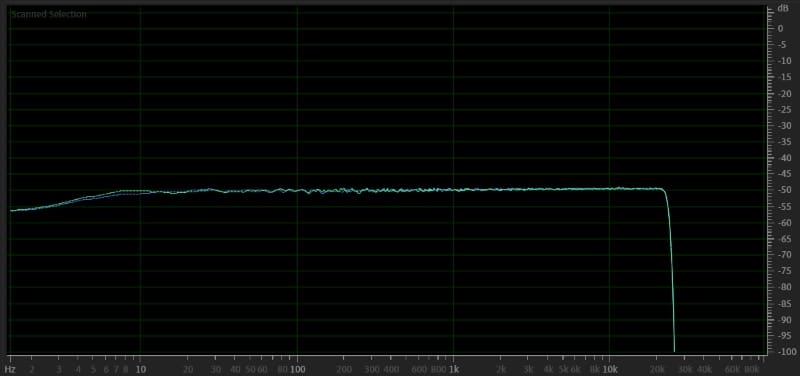
We can see that the frequency response remains flat, extends to 21 kHz, and is at -3 dB at 22.5 kHz. On the bottom end, 5 dB of attenuation is down at 1 Hz, but it’s flat from 10 Hz and up. That’s more than enough to hear everything in a typical music recording.
We can see that YouTube did indeed filter some high-frequency information. The dip starts at 15.6 kHz. Having looked at some of the other test results, I’m not convinced the ledge of information that extends to 20 kHz at a 14 dB lower amplitude is real audio. We’ll see what the sweep tells us. There is also a little more infrasonic attenuation, but very few, if any, of us have sound systems that can reproduce audio information below 10 hertz at significant levels.
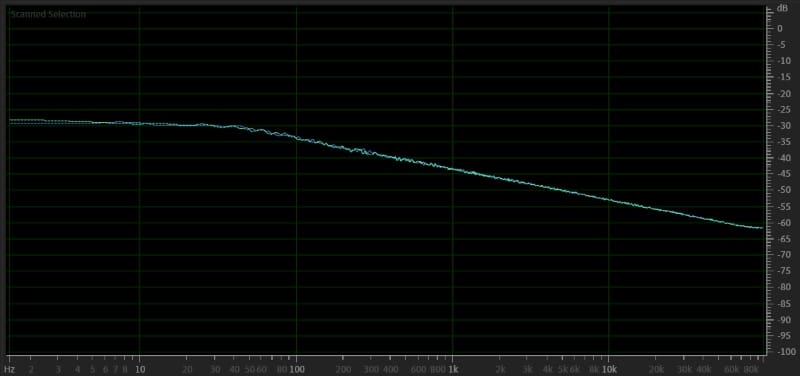
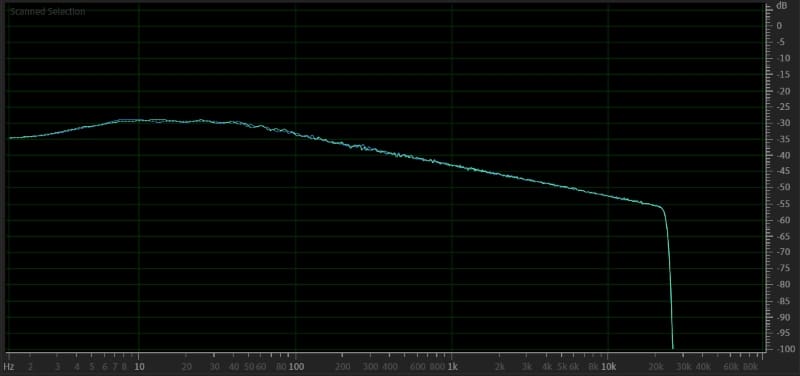
Next, we’ll look at pink noise with an expectation that YouTube has the same effect as it applies to the white noise. The first image is the pink noise signal I uploaded to YouTube. It has frequency content that extends to just under 22 kHz.
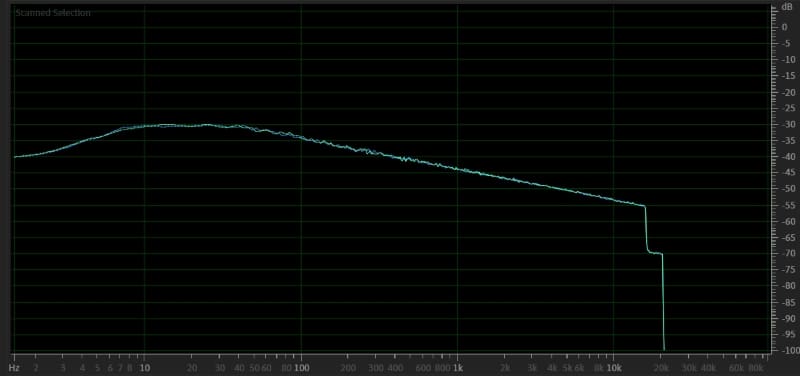
The changes in frequency response match those we saw with the white noise test. There is a step at about 16.5 kHz and a little more infrasonic roll-off. There are no surprises here.
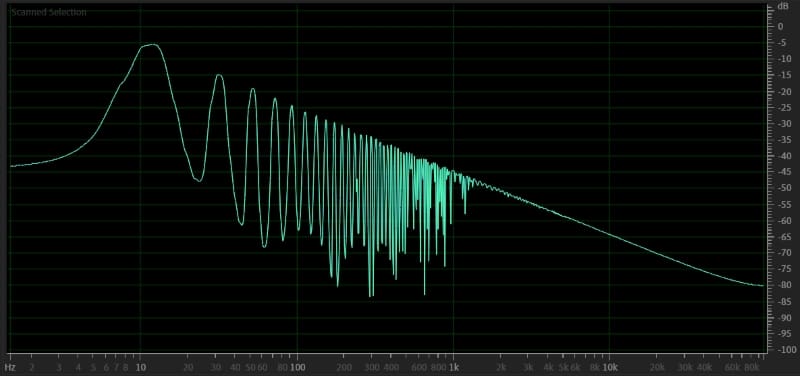
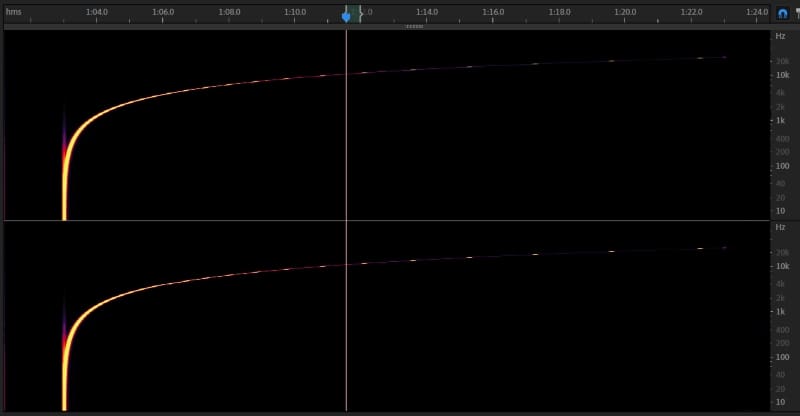
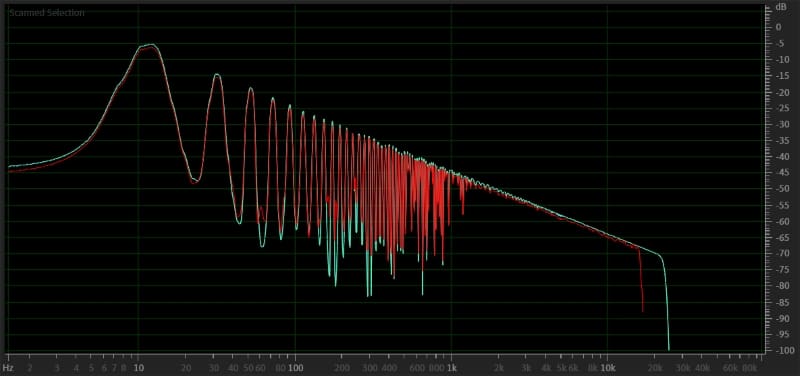
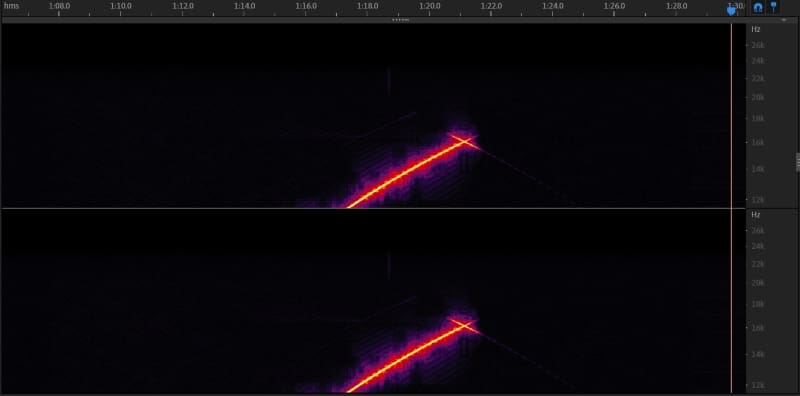
The frequency sweep is our next test. The file we uploaded to YouTube has a flat response out to about 24 kHz. There is some aliasing above that, shown by the trace extending up to the left at the end of the yellow line.
YouTube affected high-frequency information. First, the high-frequency cutoff is right at 16 kHz. This isn’t a significant issue, as few adults can hear those frequencies or higher. There is a considerable amount of aliasing happening before and after the cutoff. It’s very low in amplitude at 75 dB below the original test signal. That wouldn’t be clearly audible. There is also a lot of harmonic distortion around the test tone. The distortion shows up as fuzz above and below the yellow line.
YouTube Distortion Testing Results
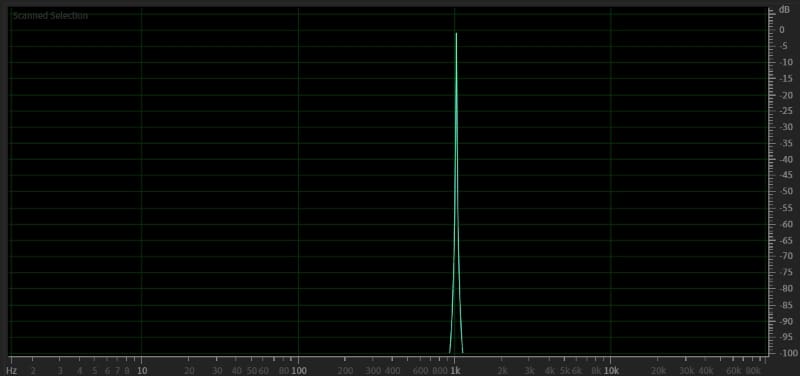
The 1-kHz high-amplitude tone test failed before I even got started. At least, that’s what I thought. If we look at the spectral analysis as it came out of the Adobe Audition video rendering process, we can see a massive amount of harmonic distortion added. Close inspection of the waveform showed about 0.21 dB of signal overlap into the clipping range.
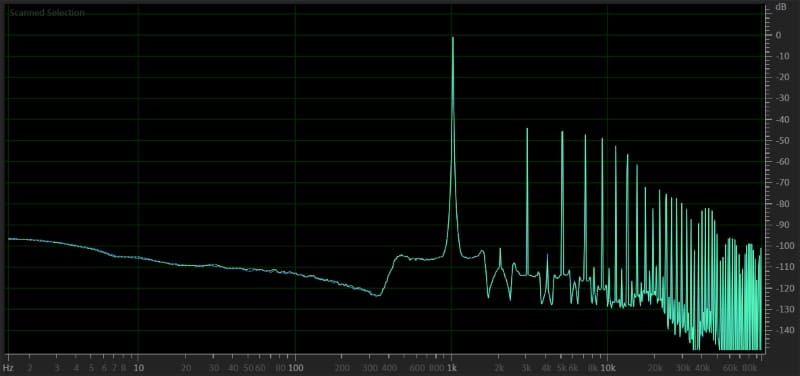
Things get weird here. The harmonic information is gone in the playback from YouTube. This observation indicates the clipping happened in the playback stage, not in the recording. Nevertheless, we can still see significant low-amplitude information added on either side of the fundamental 1-kHz frequency. These are not good results, but they are quite different than expected, based on looking at the video file.
In many cases, tests fail in different ways. These issues are why including checks and balances throughout the process is crucial. Live and learn.
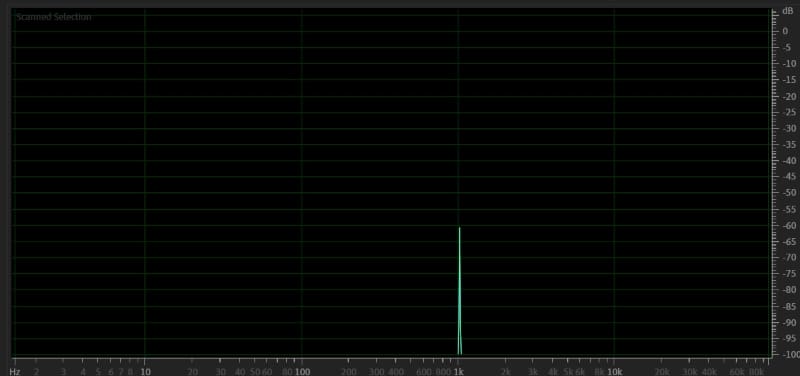
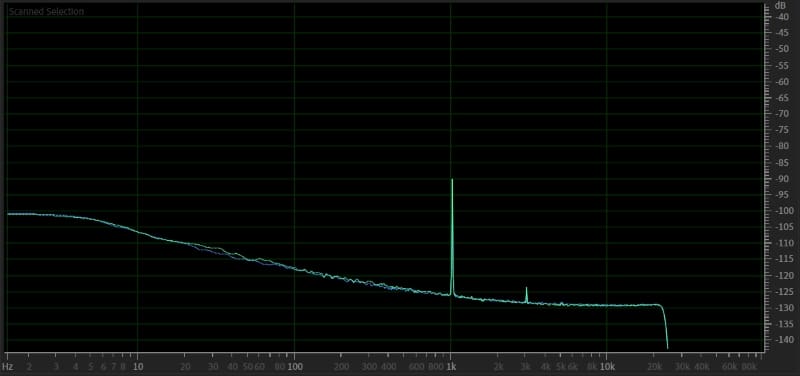
The -60-dB 1-kHz test tells us more about the distortion characteristics. The file we uploaded to YouTube shows a tiny spike at 3 kHz and other spikes at 9 and 15 kHz. We’ve adjusted the vertical scale down to see this low-level information, and we can now see the noise floor of our test track.
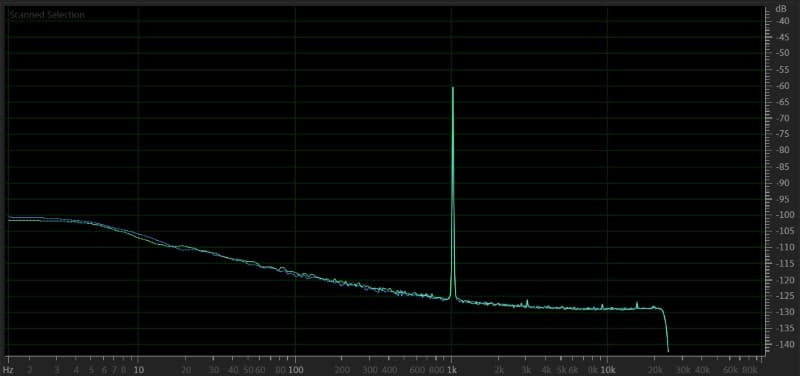
YouTube added some harmonic distortion to the test tone. There’s a prominent third-order harmonic at 3 kHz at a level of only -37.2 dB R. This means the noise is only 37 dB below the fundamental signal. That works out to a harmonic distortion level of 1.38%. That isn’t good.
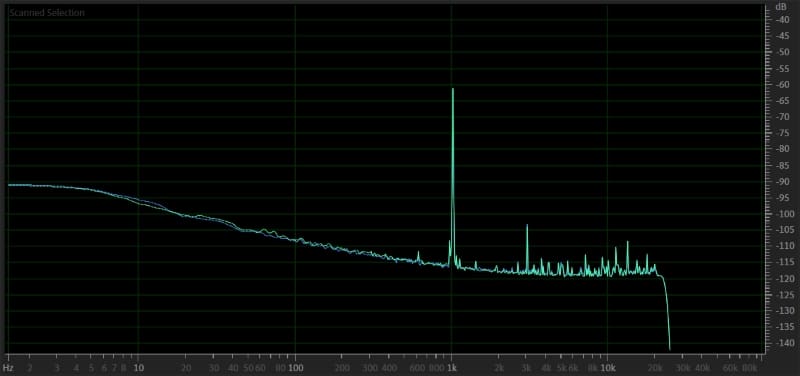
A distortion level of over 1% will be an issue for anyone who cares about audio quality. This measurement alone would represent a stopping point for those who might have been considering using YouTube as a high-quality audio source. It isn’t. We’ll finish the evaluation nevertheless.
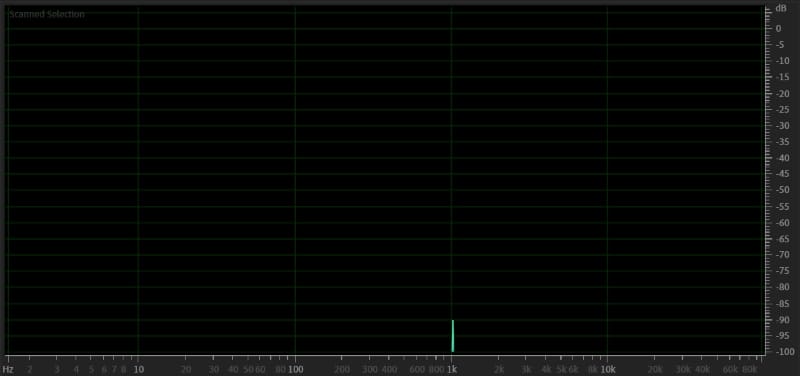
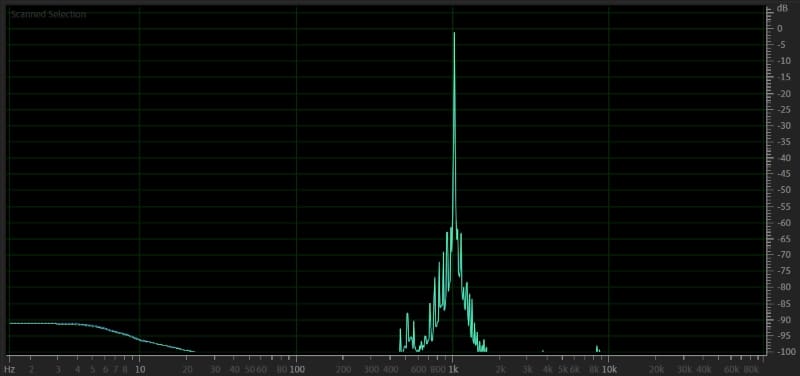
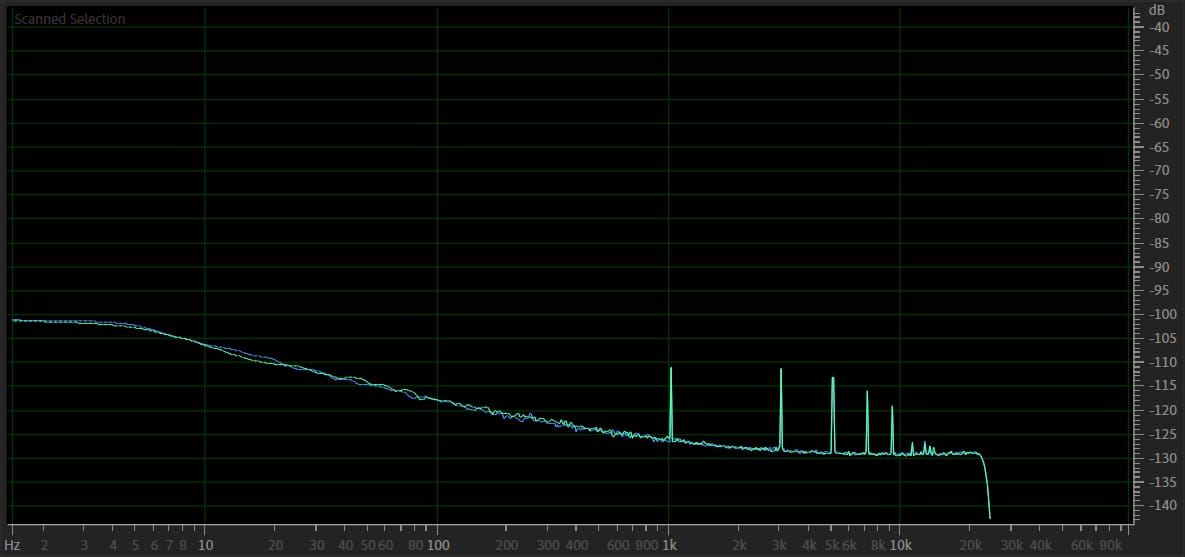
The -90 dB, 1-kHz test track is next. Here’s the spectral content of the audio file. Unfortunately, the audio compression algorithm has already added 2.05% distortion to the 1-kHz, -90-dB FS test tone.
As you can see below, uploading this to YouTube made a mess. The combination of the spikes at 3, 5, 7 and 9 kHz are louder than the original test tone. I made a spreadsheet to try to calculate the percentage distortion. The answer is 142.4%. If you hope that YouTube will accurately capture the detail in very low-level signals – it doesn’t, won’t or can’t. As such, if you upload music to YouTube, ensure that the recording level is relatively high.
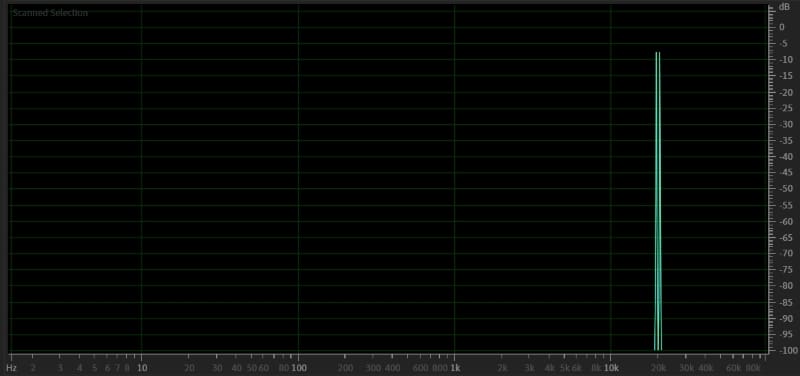
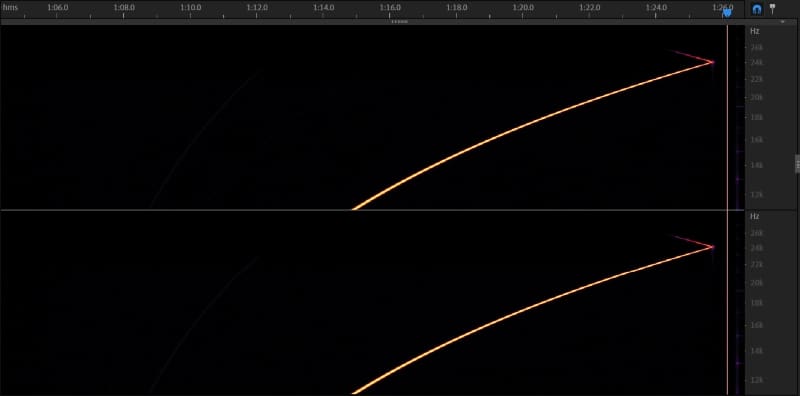
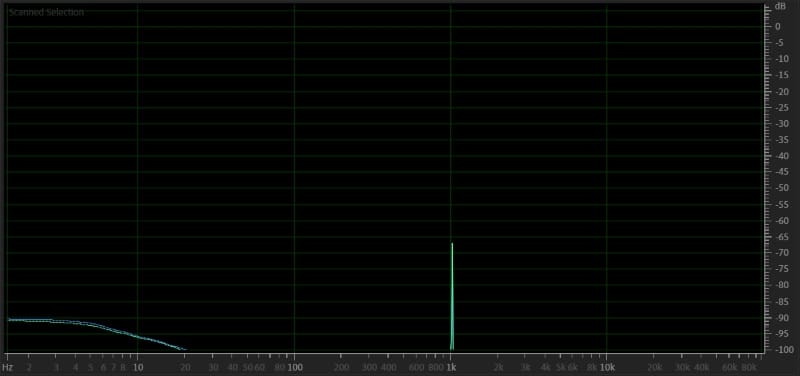
Let’s move on by looking at the intermodulation distortion test. The image below shows the 19- and 20-kHz test tones in the original video I uploaded to YouTube.
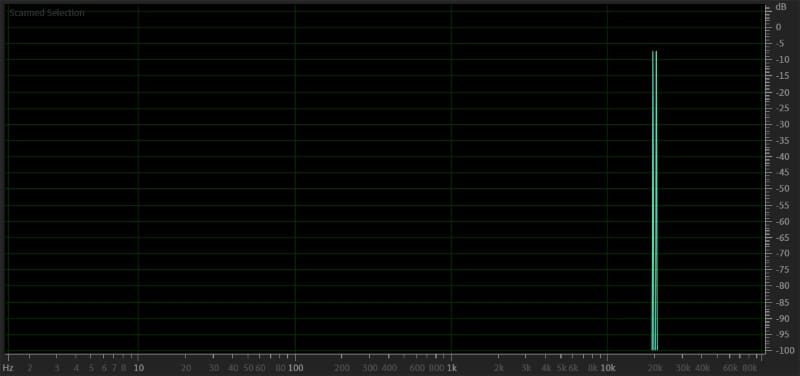
Well, the results are fascinating. First, YouTube erased the test tones, and they don’t play back when you watch the video. This makes sense as the upper-frequency limit is around 16 kHz. With that said, the product frequency, which is the difference between the two test tone frequencies, is present in the playback stream. The spike at 1 kHz is very high, showing abysmal intermodulation distortion performance. This performance is the second nail in the coffin for those hoping that YouTube is a good source for audio.
Thoughts on Audio Encoding and YouTube Performance.
Perceptual encoding algorithms like MP3, WMA or AAC are designed to reduce file size by throwing away information we can’t hear. The purpose is to reduce file size while maintaining intelligibility in the playback. While this file-size compression made it easier to download MP3 files in the early ’90s over low-bandwidth connections, it’s also convenient for data transmission in streaming services like YouTube. They employ some form of encoding that throws away audio information above 16 kHz and low-level signal information.
For the majority of us, the encoding alone isn’t an issue. Encoding is, quite literally, designed to still sound good while meeting the data compression needs of the user. If you hear Lorde, Metallica or Elvis, you’ll still know it’s them even after the audio file has been heavily compressed. That’s the point of those algorithms.
As for the distortion performance, as we’ve measured from YouTube – this is disappointing. This is more audible than the high-frequency cutoff or lost low-level signal information. Harmonic distortion makes music sound bright and harsh, especially the third-order harmonic distortion I’ve measured here. Intermodulation distortion makes midbass and bass sound fat, sloppy or muddy. The IMD performance measured from YouTube was awful.
If you right-click on a YouTube video and select the Stats for Nerds option, you’ll note that Opus (251) is listed under Codec. Opus is an audio codec designed to deliver excellent speech compression performance. The format supports bitrates up to 510 kbps and a sampling frequency of up to 48 kHz. YouTube has chosen much lower settings, with a sampling rate of around 32 kHz. The exact bitrate is reported to be somewhere around 128 kbps.
So, is YouTube a good source for high-end audio playback? Based on this test, the answer is a definite no. Given the results of GoldenSound’s testing, Tidal’s use of MQA puts it on the “no thanks” list. If you want to stream music for the time being, Qobuz is reported to be a great option. If you want your audio system to sound the best, purchase FLAC versions of your favorite artists’ work. FLAC files are bit-perfect compressed files of the original WAV format. Put those on a USB stick, and enjoy!
But Wait, There’s More!
Just as we were about to hand this masterpiece to our editing team, we realized there might be a crucial misunderstanding in our presentation. We need to differentiate between YouTube videos and the YouTube Music service. We analyzed the audio performance of a video we created and uploaded to YouTube. Reports indicate that the YouTube Music service uses a much higher bitrate to stream audio. This makes sense, as significantly more bandwidth is available when a video stream isn’t required. Please don’t confuse the two.
