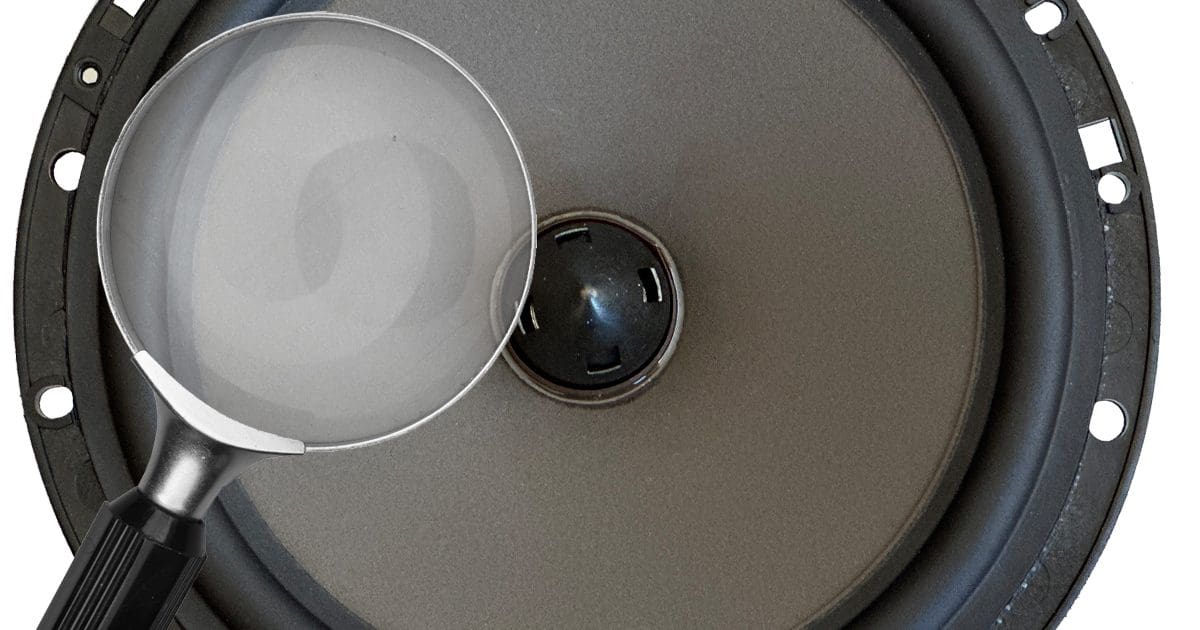
We’re now into our fourth speaker in our series about understanding speaker quality. For this article, we will analyze the performance of an old-school premium speaker, the MB Quart PWE-160. If you were into car audio in the ’80s and ’90s, then the MB Quart brand was a name you’d know well. This brand was famous for its performance in car audio competitions. So let’s see how this classic performs in the lab.
Features of the PWE 160
I am slowly working through my collection of older car audio equipment for this series of articles. I have subsidized my efforts by adding several inexpensive solutions to help make a point about speaker design and quality. In the case of the PWE 160, I got these in 2005. Sadly, they’ve sat on my shelf in the lab since then, and I only opened the box for the first time to do this testing.
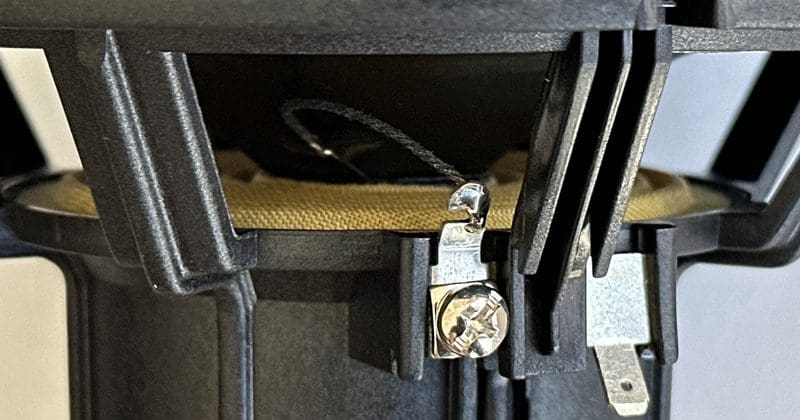
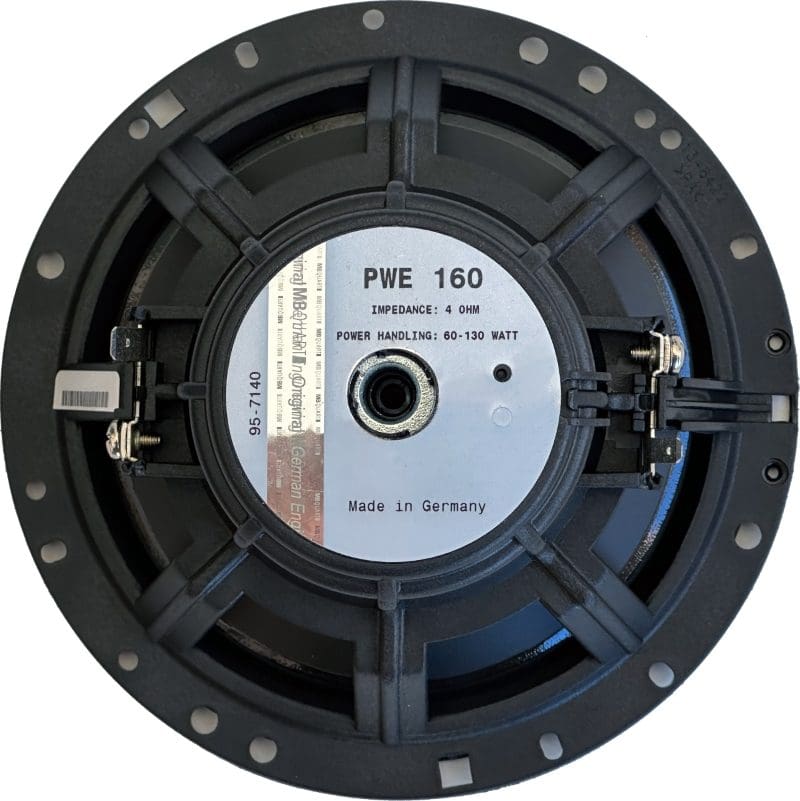
The PWE 160 kit includes a pair of 6.5-inch woofers with a nominal impedance of 4 ohms. These drivers were sold as an add-on upgrade to the company’s PCE 210 4-inch and tweeter set to create a three-way system. The speakers are based on an eight-spoke, glass-fiber-reinforced polyamide thermoplastic frame. Electrical connection terminals are on opposite sides of the basket and include spade and screw-down provisions. The tinsel leads are a typical old-school arced design and aren’t sewn to or woven into the spider. Unfortunately, I could hear the tinsel leads hitting the cone when I was breaking in the speakers. Speaking of the spider, it appears to be a linear design and not cupped.
The cone feels as if it’s made of injection-molded polypropylene with a lightly-textured damping coating on the front surface. The woofer uses a rubber surround and features a phase plug rather than a dust cap. The plastic frame encloses the magnet but is likely a compact ceramic design.
MB Quart lists these drivers as capable of handling up to 130 watts of power. The specified operating frequency range is 38 hertz to 5.6 kHz, though no tolerances or quantifiers are presented with that information.
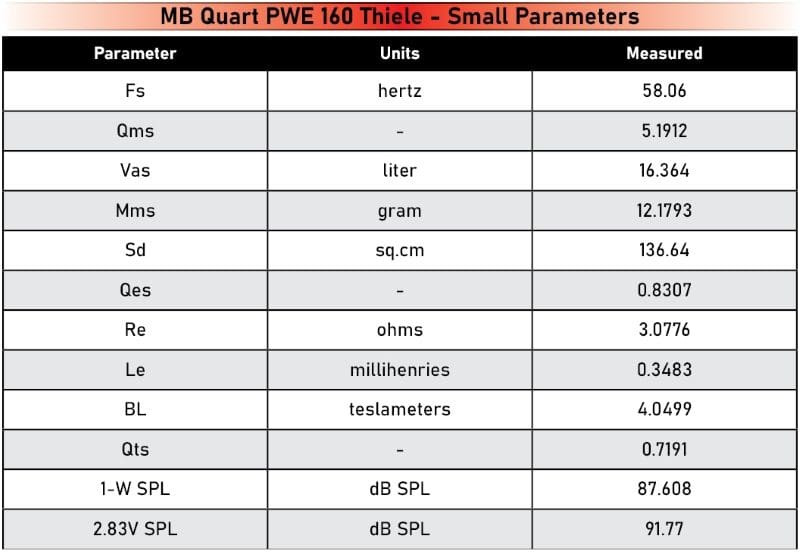
MB Quart PWE 160 Thiele/Small Parameters
As with all of the drivers I’m analyzing in this series, I start the testing process by breaking in the drivers, feeding them with a low-frequency test tone at a level adequate to exercise the suspension. After letting the driver “bake,” as I call it, for about eight hours, I turn off the signal generator and let it cool for a few more hours before measuring the Thiele/Small parameters. I use an added-mass technique with my Woofer Tester II for compliance evaluation measurements.
The break-in process resulted in a significant change in the Thiele/Small parameters. New out of the box, the driver had a resonant frequency of 70 hertz and an equivalent compliance of 12.53 liters. After eight hours of exercise, those numbers dropped to the as-shown 58 hertz and 16.3 liters. These speakers need to be broken in thoroughly to get optimal performance.
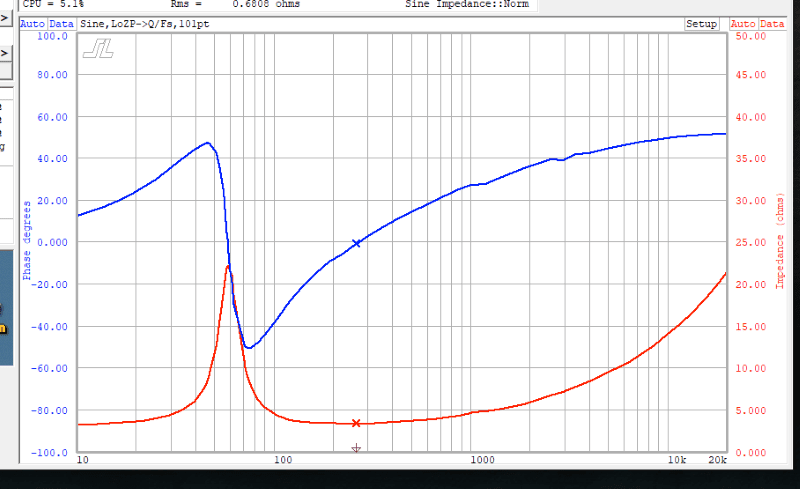
The first of few items worth noting about the PWE 160 is its moderately low DC resistance for a 4-ohm driver at 3.08 ohms. While this would increase how much power an amplifier can provide, it also increases the current requirements of the amp. This increase in current can lead to an increase in the distortion the amplifier adds. The inductance value of 0.35 millihenry tells us the woofer doesn’t include any inductance-managing technology like a shorting ring or a copper t-yoke cap or sleeve. Drivers with those technologies have half to a third as much inductance. The resonant frequency (Fs) and compliance (Vas) indicate that the driver should provide reasonable midbass output from a relatively compact enclosure. The Total Q (Qts) is reasonable at 0.72 to give a good balance of control and output in the lower bass region.
The impedance and phase response plot shows that the driver has a system resonance around 1,000 and just under 3,000 hertz. You can see these as small dips in the blue phase trace. We’ll see how those affect frequency response and distortion in the acoustic measurements.
Driver Application Simulations
Unfortunately, I can’t find any data about the driver’s excursion capabilities, so modeling the power limits of the driver in various enclosures won’t be possible.
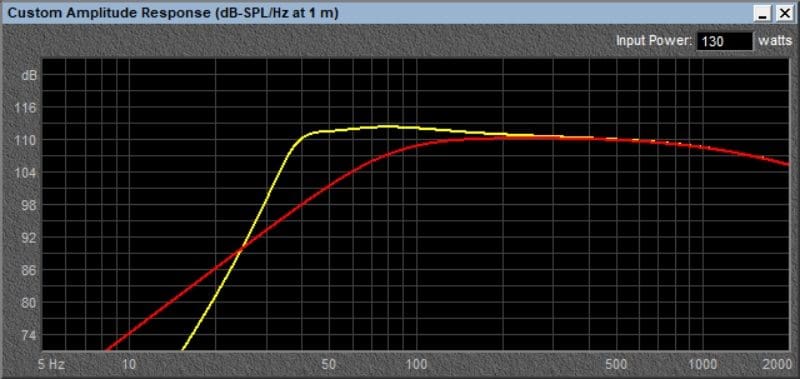
After loading the measured Thiele/Small parameters into BassBox Pro 6, I asked the software to provide a suggested sealed enclosure with a low Qtc value. The simulation software presented a suggested net internal air volume of 0.636 cubic foot. This enclosure provides a -3 dB frequency of 76.85 hertz and a Qtc of 0.716. This driver would have worked well in the typically undersized enclosures common to car audio retailer display boards and would also work well in a door installation. In addition, that suggested volume would make these woofers compatible with a kick-panel installation that was open on the rear.
I asked the software to simulate a vented enclosure, and it suggested an enclosure volume of 1.867 cubic feet tuned to just under 43 hertz. This enclosure volume is large, but as a result, the software predicts an F3 frequency of just under 36 hertz. Unfortunately, even with 50 watts of power, the excursion will be up around 6.5 mm at 62 hertz. It’s unlikely the driver is anywhere near linear at that level, so distortion will be a significant issue. Ultimately, there’s no reason to build this type of enclosure in a vehicle, so it’s a moot point.
Measuring Speaker Distortion at Different Drive Levels
With the speaker loaded into my test enclosure, I set up my Clio Pocket audio analyzer microphone 12.5 cm from the mounting surface to capture fundamental and harmonic distortion information from the speaker at different drive levels. The standard for speaker response measurement is 1 meter. However, because of reflections from nearby surfaces in the room, I don’t get an accurate quantification of the speaker’s response if I measure at that distance. This close-mic location dramatically reduces the effect of those room reflections on the measurements. To know how loud the speaker is in reference to 1 meter, subtract 18 dB from the dB SPL scale on the left of the graphs.
If you’ve read the other articles in this series, you’ll note that I’ve added a fourth trace to each graph. The green line represents the drive level’s total harmonic distortion (THD).
The first test was performed at 0.1 watt of power. We can see that the frequency response is relatively flat from 70 hertz to just under 1 kHz. In terms of distortion, this driver performs much better than many others I’ve tested in the lower midrange region above 100 Hz. For example, at 200 Hz, total harmonic distortion (THD) is just under 0.175%. The Metra speaker was at 1.06%, the Skar speaker was at 0.6%, the MTX was at 0.44%, and the Honda speaker was at 0.316%.
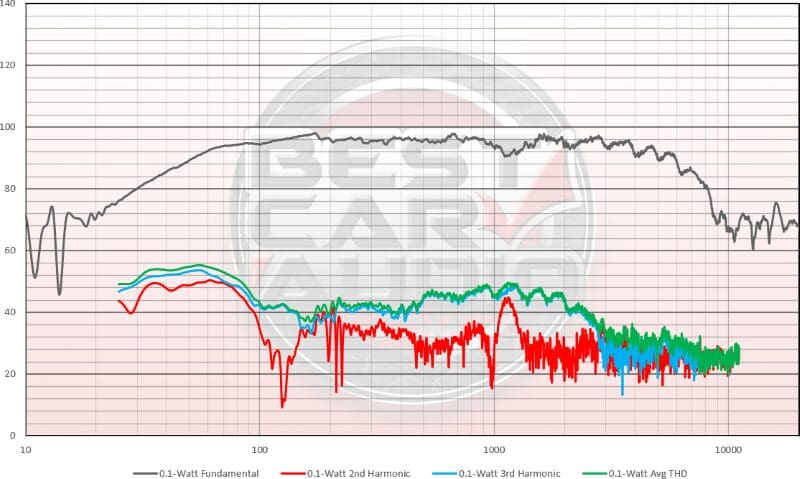
The bump in the impedance and phase response we saw earlier manifested as a peak in the second-order harmonic distortion output at around 1,175 hertz. This resonance also correlated to a dip in the fundamental frequency response around the same frequency.
Increasing the input to 0.316 watt had a minimal effect on how much distortion was added to the output signal. THD at 200 hertz is now at 0.35%.
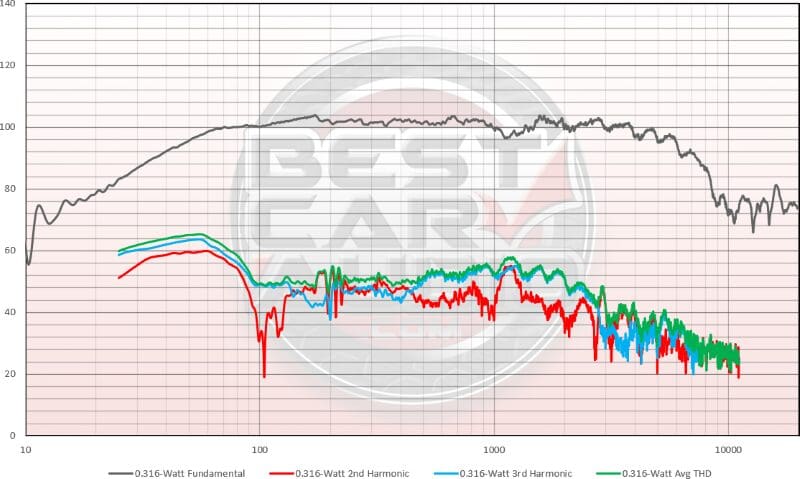
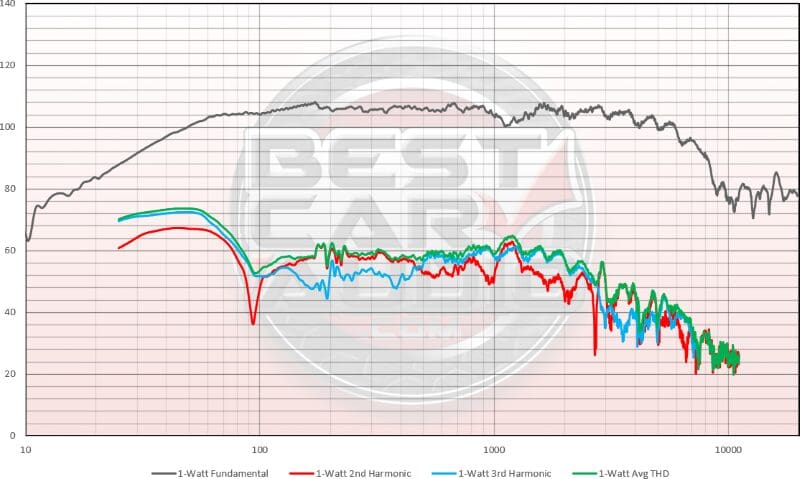
The subsequent measurement is at 1 watt of power. We can see from the graph below that the second harmonic level is starting to be more prominent. Distortion at 200 hertz is now up to 0.57%. Once again, this is better than some of the speakers I’ve measured at 10 dB less output. We can also extrapolate a 1-watt efficiency of about 87.6 dB. That matches the calculation in the Thiele/Small parameters perfectly.
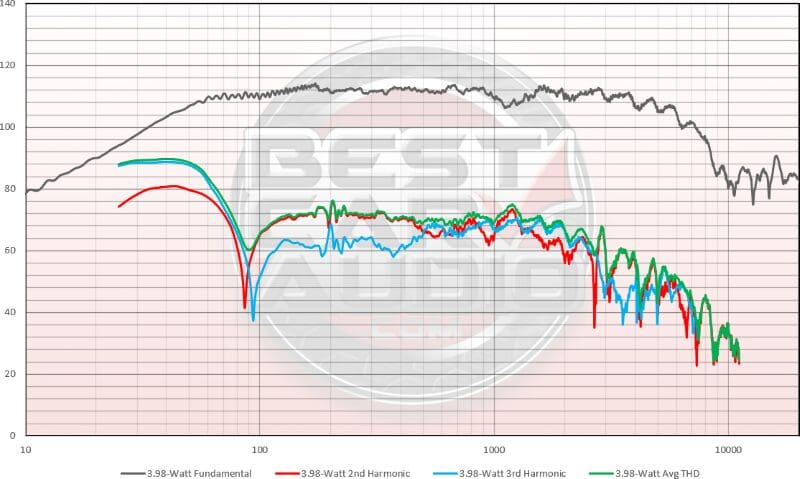
The next test level is at 3.98 watts of power. Honestly, I doubt the accuracy of the distortion measurements below 100 Hz. There’s no scientific reason for significant dips in the distortion response at 86 and 94 hertz. I’ll look into this to find out what happened. That said, the information above those frequencies remains consistent and follows the trend presented by the rest of the measurements. The second harmonic distortion is now much more significant in the region from 100 to 500 hertz. THD at 200 hertz has climbed to 1.24%
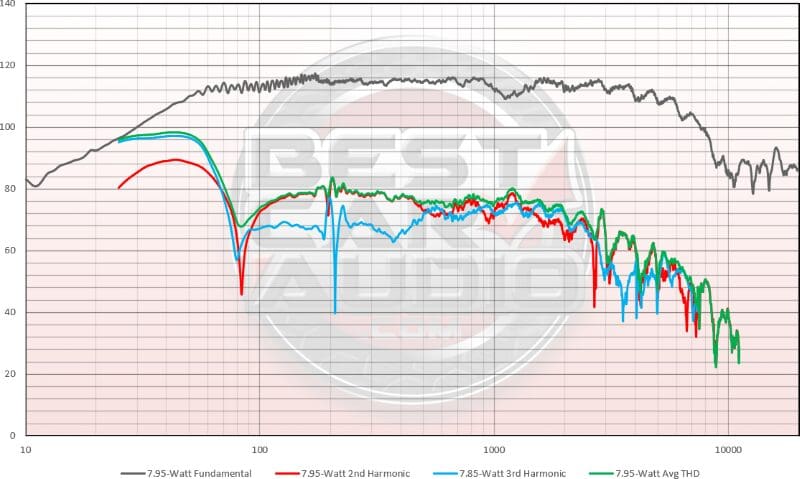
With the drive level to the speaker increased again to 7.95 watts, we are starting to see the effects of not having any distortion-reducing technology in the motor assembly. As a result, we are up to 1.93% distortion at 200 hertz. This isn’t a disaster, but the speaker will start sounding like it’s working hard.
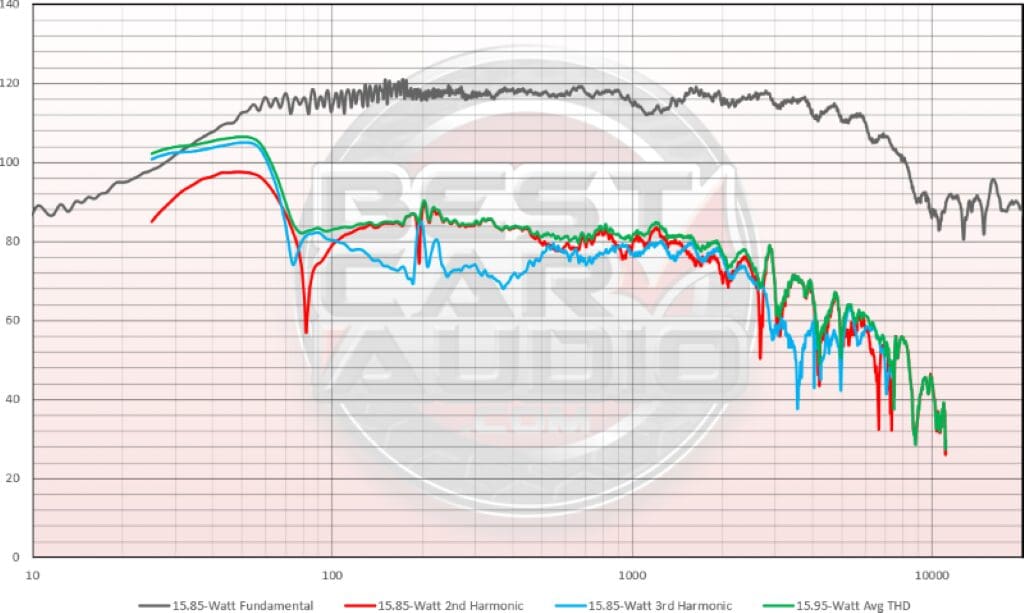
With the output at 15.85 watts, we can see a jump in the third harmonic level down around 100 Hz. This indicates that something has become decidedly non-linear. If I had to hypothesize, I’d credit this to variances in inductance over the cone excursion range. THD at 200 hertz is now just under 4%.
The next measurement was taken at 31.7 watts to the speaker. As you can see, significant harmonic content exists in the (dark gray) fundamental output trace. However, the change in distortion isn’t substantial, with an increase up to around 5%.
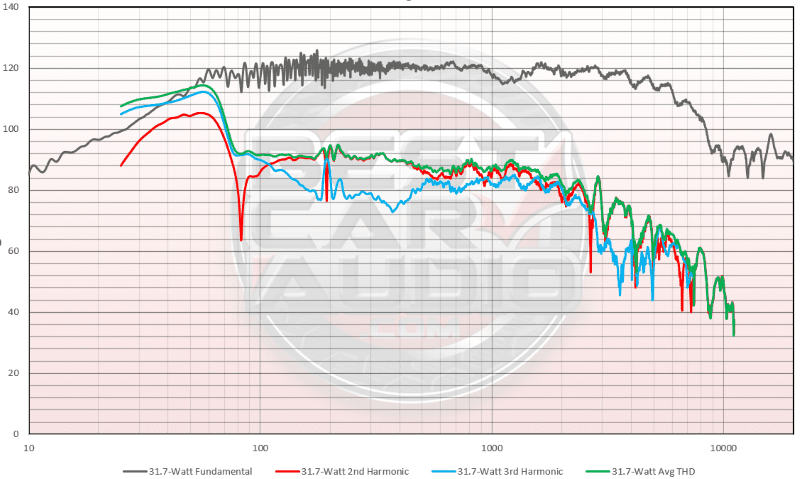
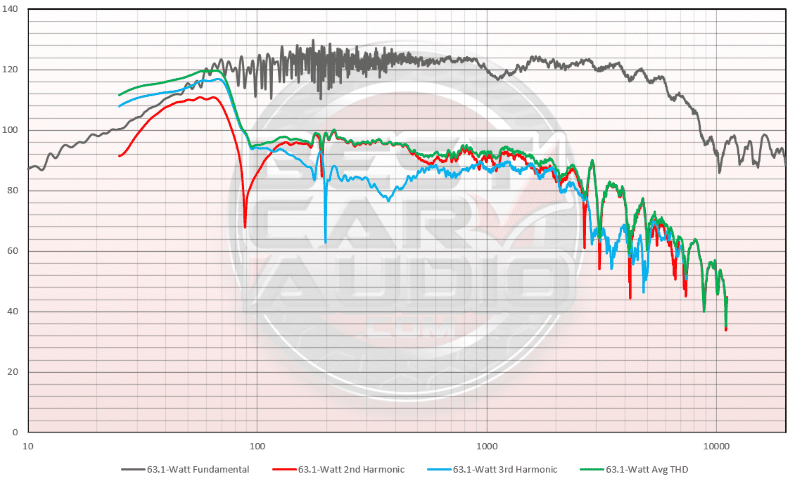
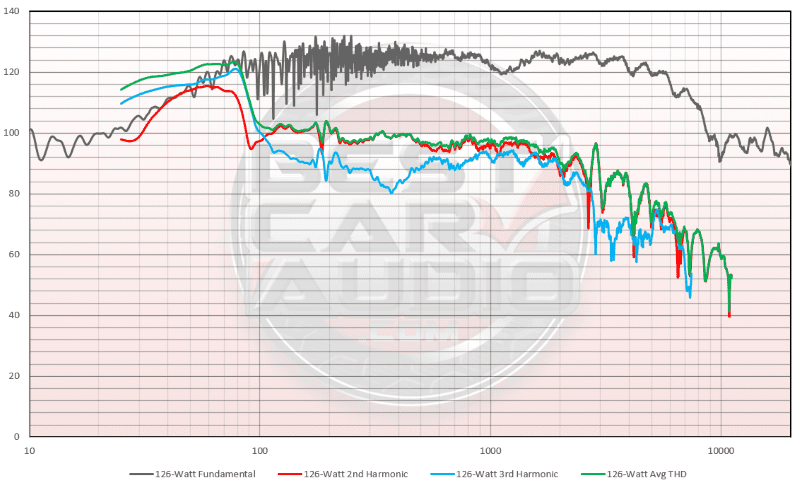
The next two power levels are 63.1 watts and 126 watts. The fuzziness in the fundamental output makes it very difficult to calculate a specific level of distortion. So I’m going to add another way to analyze the data. First, let’s look at the charts. It’s interesting to see that things appear to behave quite well in terms of distortion down to about 100 Hz, even at these significant levels.
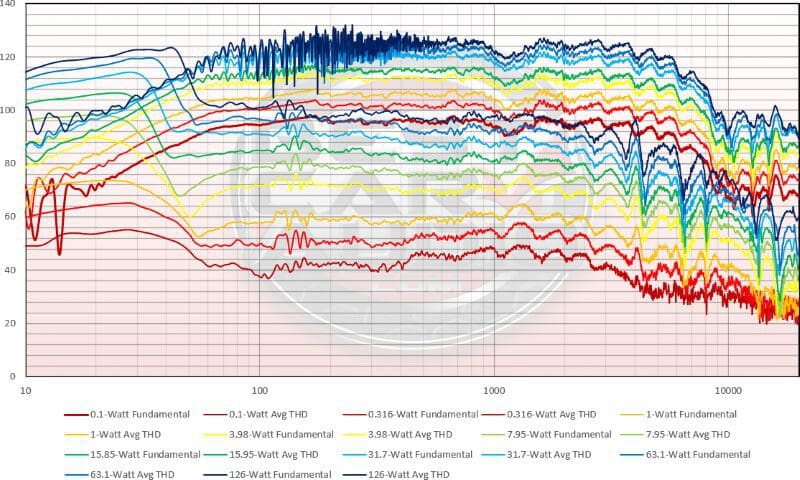
The graph below shows all the power-level measurements at once. There are two traces for each measurement level. The upper trace is the fundamental output, and the lower trace is the total harmonic distortion. The takeaway from this chart is that the distortion gets louder relative to the fundamental output with each increase in drive level. For example, look closely at the three blue traces representing 31.7, 63.1 and 126 watts of power. There’s a 3 dB difference between the fundamentals but an increase of 5 or 6 dB in harmonic distortion.
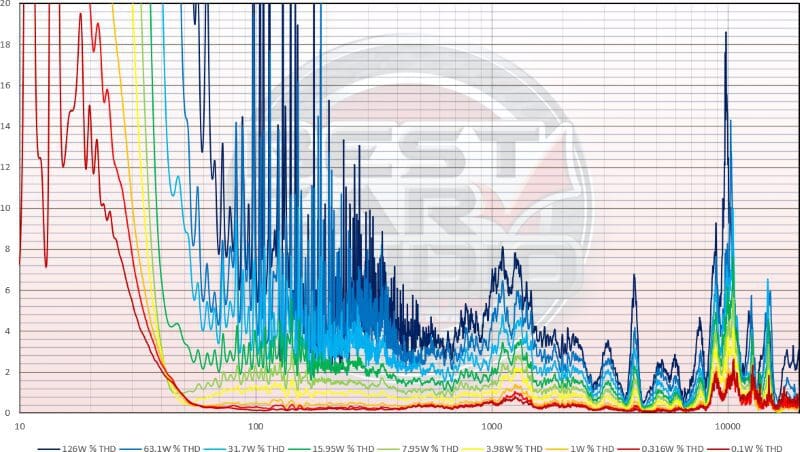
The last graph took a little time to create. This graph shows the total harmonic distortion percentage at each drive level. I reversed the order of the traces from high power level to smallest to make the lines easier to see on the graph. The idea is to mentally average the distortion levels to understand how the speaker performs as it’s pushed harder.
Our First ’Good‘ Solution in the Understanding Speaker Quality Series
It was nice to see that the measurements of the PWE 160 driver match MB Quart’s reputation of offering good-sounding speakers. The distortion is noticeably less than the other drivers reviewed in this series. If you’re concerned about accuracy and clarity in your car audio system, drop by a local retailer and audition the speakers available to upgrade your vehicle. Ask to have the speakers played moderately loudly, so you can hear the effect of any distortion-reducing technologies that might be included. If they sound harsh, aggressive, bright or sloppy in any way, they might not be the best solution.
