Our first subject in this series of articles about understanding subwoofer quality is a low-cost 10-inch driver from a local electronics parts store. This manufacturer markets this transducer as a “full range” speaker that “looks and sounds great” and not a subwoofer. We’ll start by measuring the Thiele/Small parameters of the driver, then break it in to see if things change after some use. From there, we’ll do some simulations in BassBox Pro and then move to test the output and distortion characteristics of the driver.
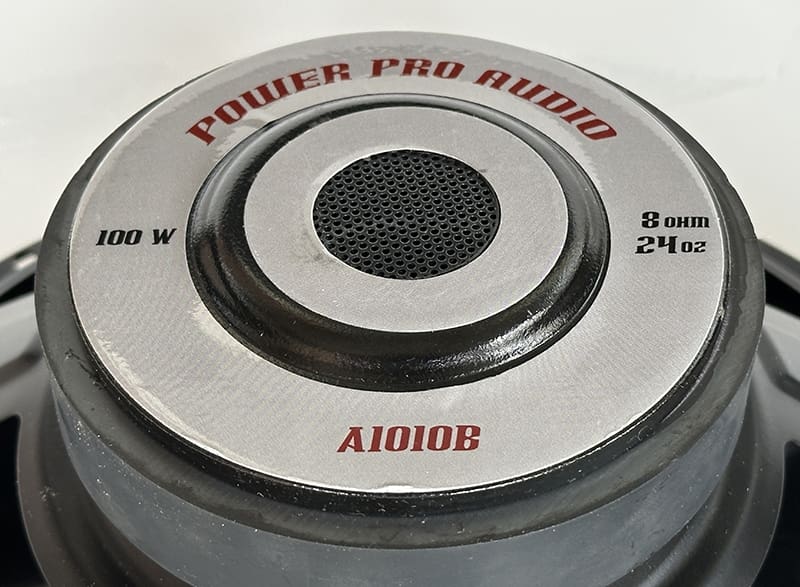
Power Pro Audio A1010B 10-inch Woofer
This woofer retails for as little as $25 Canadian, depending on which surplus store you’re shopping at. It has a rubber surround. The cone and a dust cap are injection molded from polypropylene. The maximum power handling is rated at 100 watts, and the sensitivity is specified as being 91 dB with a tolerance of plus or minus 3 dB. Actually, they list the efficiency as 91+/-3 (dB /w.n). I don’t know what “dB/w.n” means, and neither does the internet. The sensitivity specification is a calculation based on Thiele/Small parameters, so having a tolerance implies significant manufacturing variances between units – something you want to avoid. Frequency response is specified as being 28 Hz to 4 kHz with no tolerances provided.
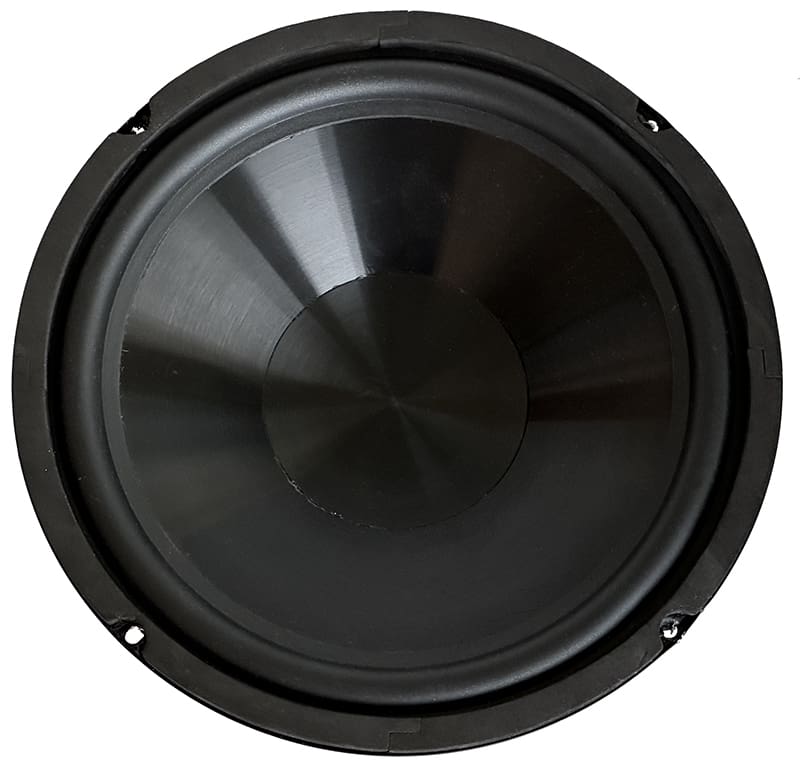
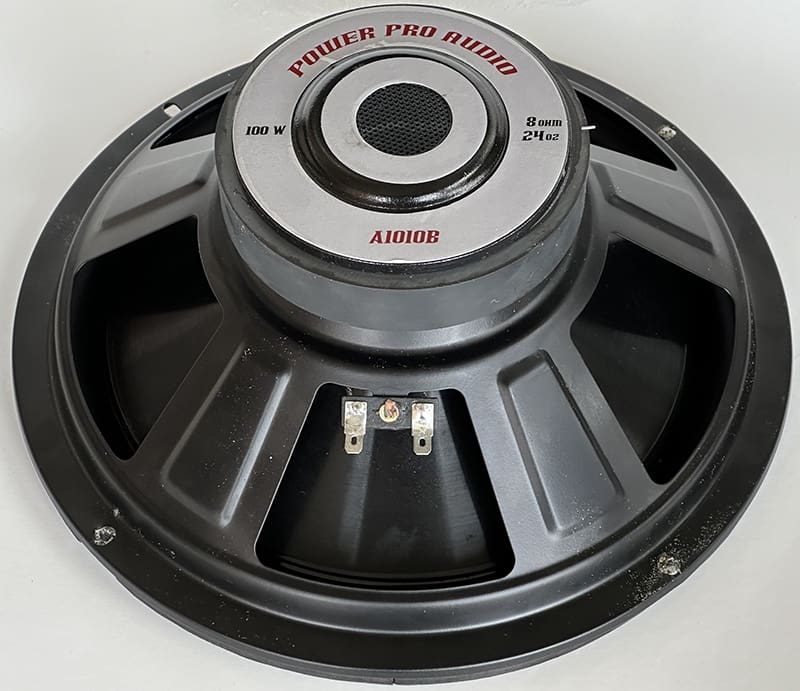
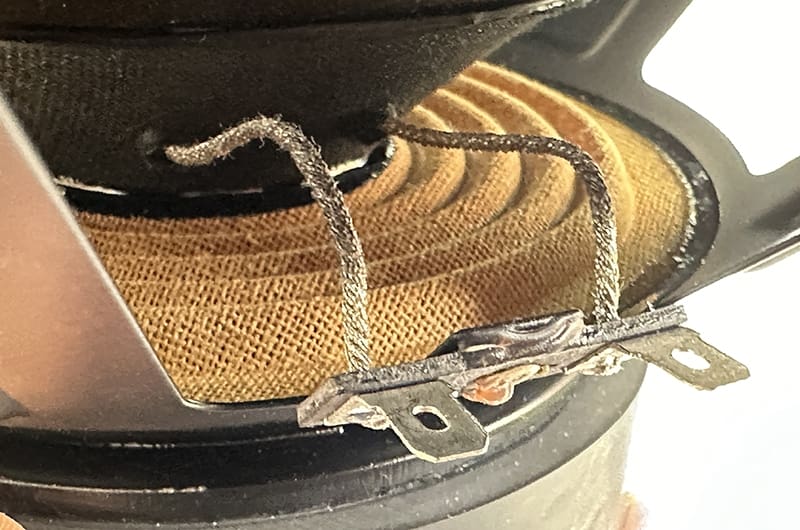
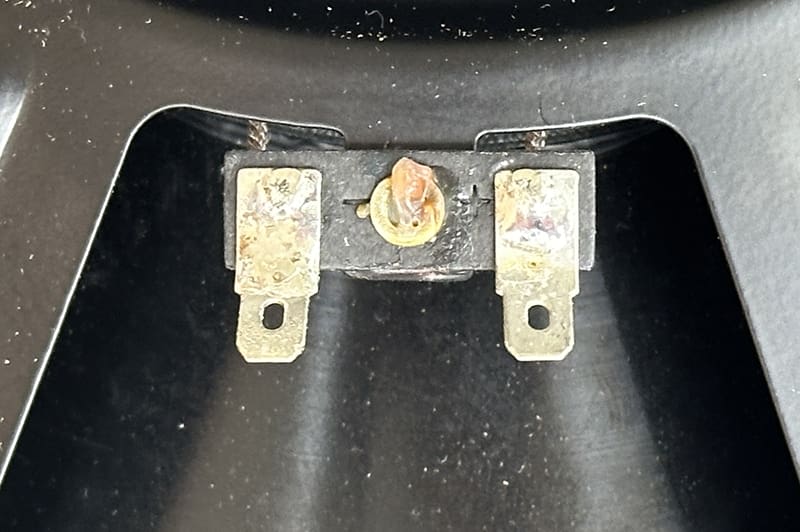
The driver is based on a thin stamped steel frame with five spokes. A set of quick-connect terminals function as electrical connections. The magnet is a single 24-ounce ceramic unit. There’s a small bump in the back plate, and the vent in the center includes a mesh cover to keep debris out. The tinsel leads are not sewn or stitched. The spider appears to be a linear design. Finally, the voice coil looks to be about 1.5 inches in diameter and has a nominal impedance of 8 ohms.
Speaker Thiele/Small Parameters
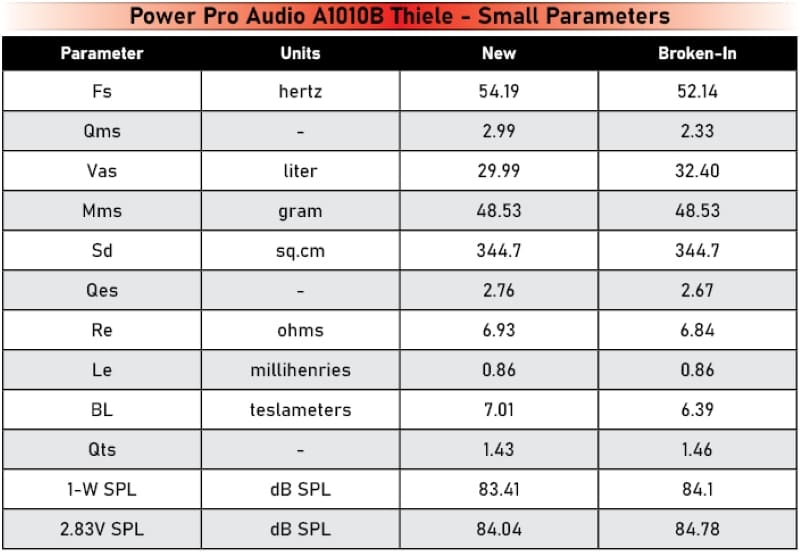
We set the driver up on our test bench and performed a set of measurements to calculate the Thiele/Small parameters of the driver. We always use the added-mass method of calculating the suspension compliance. After we had the basic parameters, we fed the driver with a 28-hertz test tone at 21.2 volts and let it play for eight hours. This voltage represents about 56 watts of power to the 8-ohm load. We tried a little more voltage, but the speaker protested by starting to smell sour. We gave the driver another four hours to cool off and measured the Thiele/Small parameters again. The results of the two tests are below.
As you can see in the chart, the parameters didn’t change much. The Fs dropped from 54 to 52 Hz, and the compliance increased from about 30 to just over 32 cubic feet. As such, this driver changes very little during break-in.
What is concerning is the Qts value of the driver at 1.46. That’s one of the highest values we’ve ever measured from a woofer. This thing should ring like a church bell at noon around its resonant frequency. We’ll have to see what happens once loaded into the enclosure. The other issue is the efficiency specification. Our measurements predict a 1-watt/1-meter efficiency of just over 84 dB. That’s a long way from 91, and it’s plus or minus 3 dB tolerance.
BassBox Pro suggests a sealed 1.59-cubic-foot enclosure as a High Output Design and 1.85-cubic-foot as the High Fidelity application. The latter has an F3 frequency of just 46.77 hertz and a Qtc of 1.462 – neither of which is far from the Fs and Qts values. Our 2.1-cubic-foot test enclosures should work fine to present a near-infinite baffle simulation.
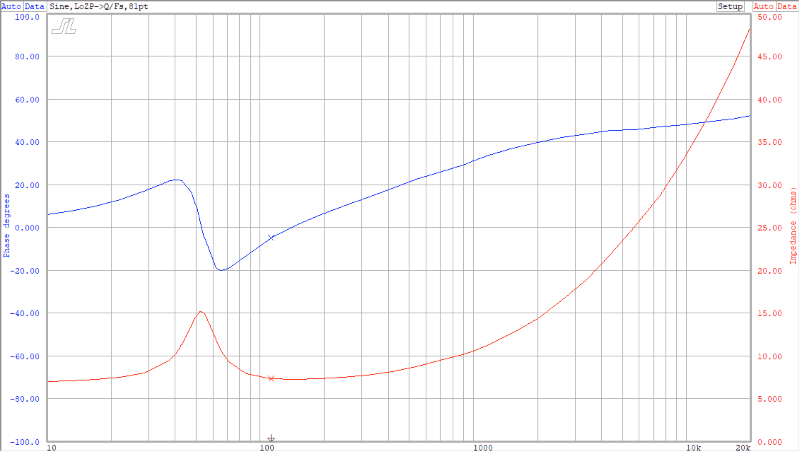
The impedance and phase curves don’t show giant resonances – though there might be a little something around 900 Hz. High-frequency reactance isn’t crazy, as the small voice coil doesn’t present much inductance.
Power Pro Audio A1010B Acoustic Measurements
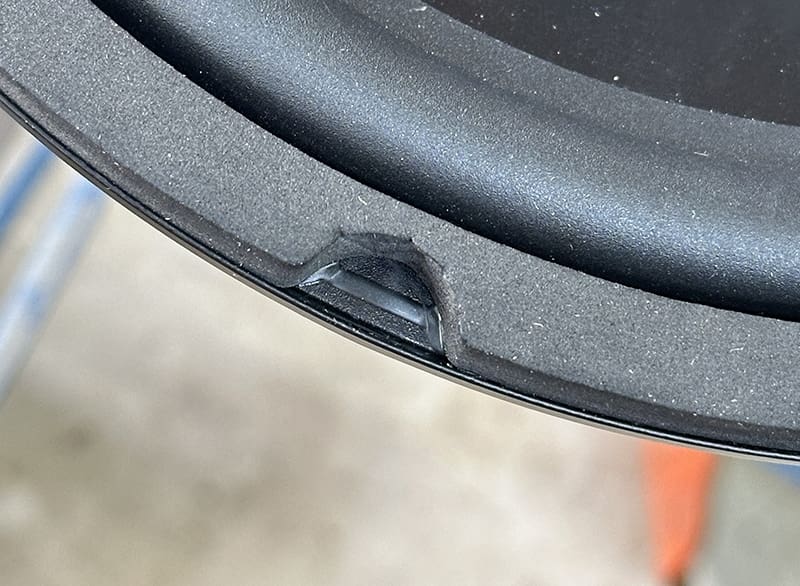
After all the measurements and break-in, we were ready to install the A1010B into our test enclosure. As they say, “There’s always something.” They didn’t cut out the rubber surround around the mounting holes. Not wanting to pull the surround away from the basket, we knew just running the screw through it was a bad idea. We used a small Olfa knife to remove the surround and expose the basket. We noted that whatever adhesive they used to attach the surround to the basket does a great job of holding the two together. So, it’s a win for the glue and a fail for the attention to detail in surround design. Sigh.
OK, everything’s finally ready to go. Let’s start with the acoustic response and distortion measurements of the A1010B woofer. We’ll start at 0.1 watt, then increase by 5 dB until 10 watts. After the 10-watt level, we’ll increase by 3 dB as distortion will increase much faster with the power increase.
There’s one thing to note in these tests: All the power calculations (and chart labels) are for 4-ohm drivers. The A1010B is an 8-ohm driver. As such, you can cut the power by 50%. Second, the measurements are taken with the microphone 12.5 cm from the woofer cone. If you want to calculate the 1-meter output level, subtract 18 dB from the scale on the left of the graph.
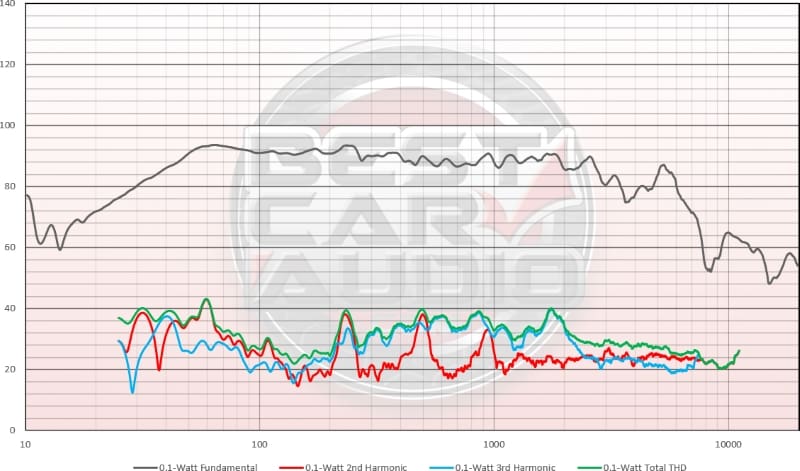
The first observation is that the driver has unexpectedly good midbass and lower midrange performance. It’s adequately flat out to about 2 kHz. This performance falls short of the 4 kHz claim on the packaging. The expected output and distortion bump around the driver’s resonant frequency in the enclosure (~60 Hz) showed up exactly as expected.
While the frequency response through the midrange looks relatively flat, there are second-order distortion peaks at 230 and 500 and a third-order peak at 1.8 kHz. That third-order issue would sound particularly harsh. The expected rise in distortion at lower frequencies is present but not significant.
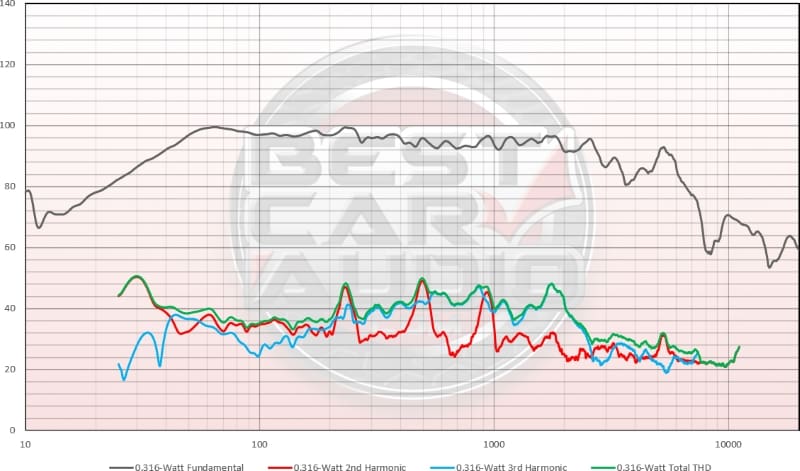
Bumping the output by 5 dB by driving the woofer with the equivalent of 0.316 watt into a 4-ohm load showed a noticeable increase in second-order distortion around 50 and 150 Hz. The midrange peaks are more intense and accompanied by more second-order distortion at 960 Hz. So far, nothing horrible is happening.
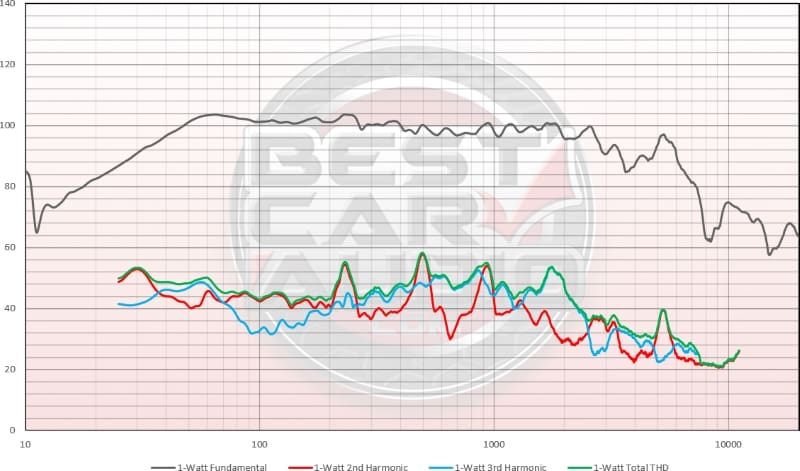
At a drive level equivalent to 1 watt into a 4-ohm load, we see a noticeable increase in third-order distortion below 40 Hz. Everything else increases pretty linearly.
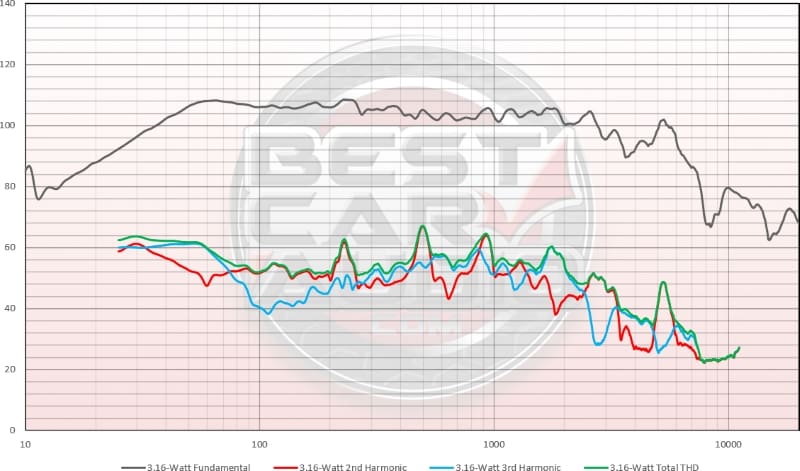
Now, at 3.16 watts into a 4-ohm load, the third-order low-frequency distortion has overtaken the second-order. The jump in added distortion around 30 hertz was almost 20 dB. This odd-ordered distortion implies some non-linearity in the suspension or motor.
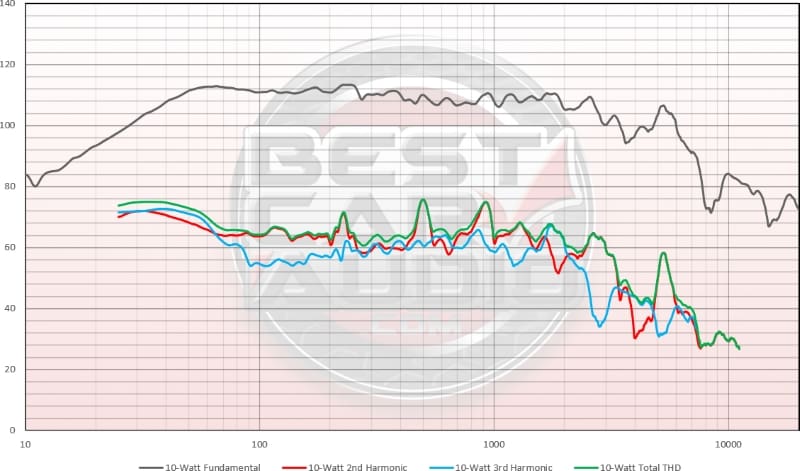
We bumped the power up to 10 watts into a 4-ohm load, which would be 5 watts into this woofer. We are seeing some excursion, and the distortion levels below 100 hertz are becoming significant. We will compare specific distortion measurements at 30, 40, 50, 60, 80, 100 and 120 hertz after we look at all the graphs.
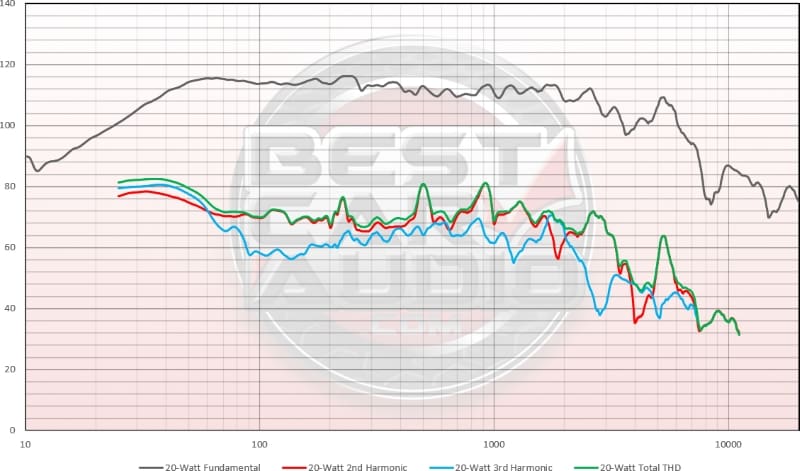
With an equivalent drive level of 20 watts into a 4-ohm load, the woofer didn’t change in characteristics much from the previous measurement. Whatever was upsetting it didn’t get significantly worse. The second-order distortion between 100 and 150 Hz increased more than the third-order in the same frequency range.
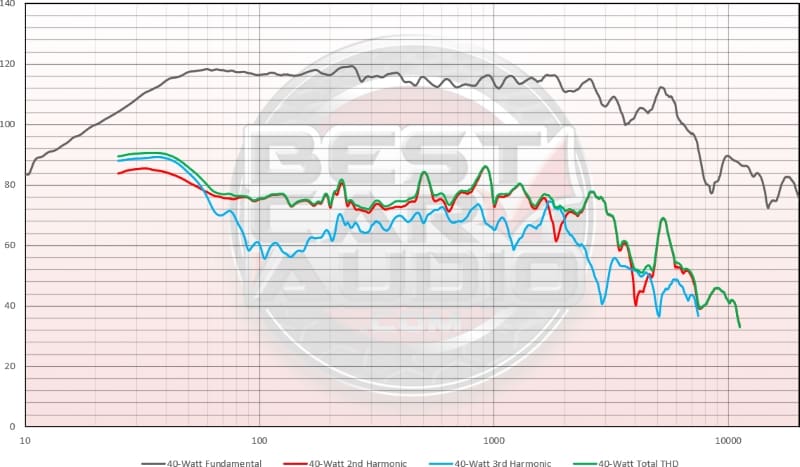
Now, we are at a drive voltage of 40 watts into a 4-ohm load. Third-order distortion around 30 to 40 hertz increased more than second-order. Again, second-order distortion in the upper bass and lower midbass increased more than third-order content.
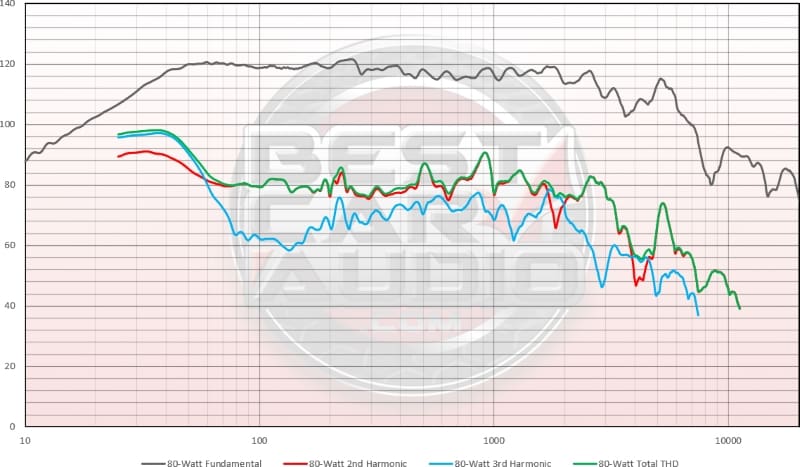
Up at an equivalent drive level of 80 watts into a 4-ohm load, the changes repeated as they did between 20 and 40 watts. At this drive level, we see over 1% THD everywhere below 120 Hz and over 10% THD below 40 Hz.
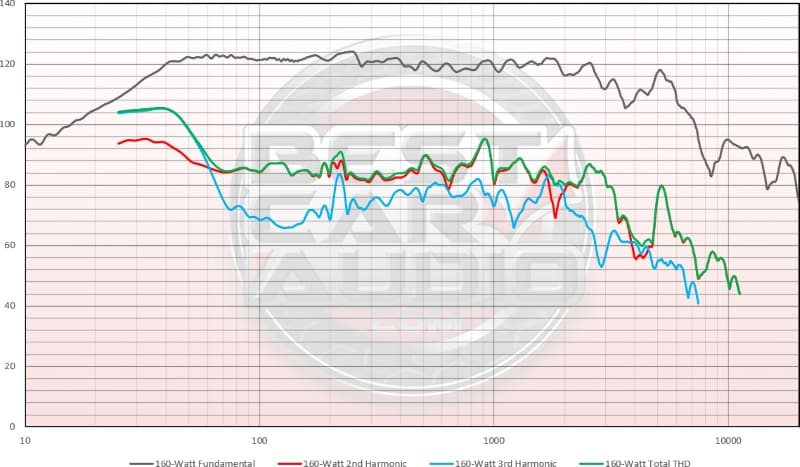
The last measurement we took was at an equivalent power level of 160 watts into a 4-ohm load, so about 80 watts for this driver. Given its rating of 100 watts, we didn’t want to go any further.
The harmonic content is now starting to appear as ripples in the frequency response graph. Distortion at 40 Hz is in the 20% range, and even 60 Hz is over 2%.
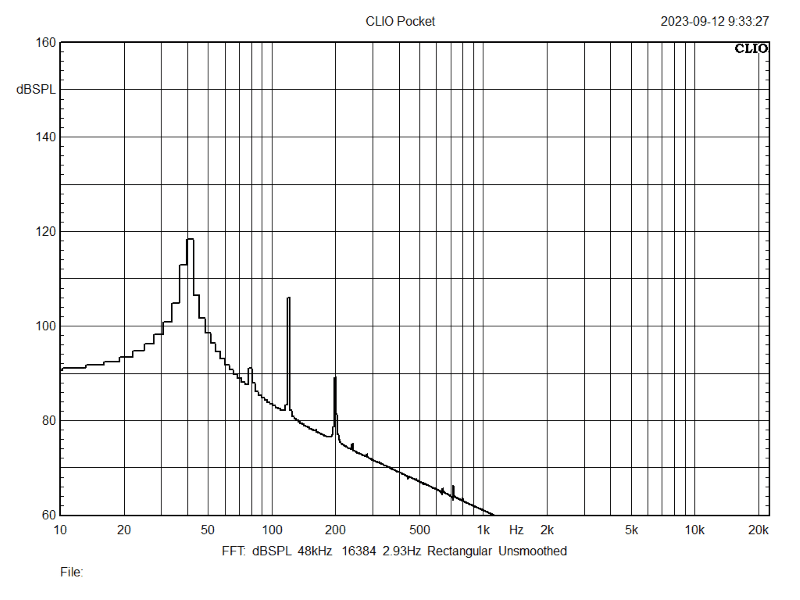
The graph above is an FFT measurement of the woofer’s output with a single-frequency 40 Hz test tone at 25.29 volts, which is about 80 watts to this driver. You can see the spike at 40 Hz at an amplitude of just over 118 dB SPL. The little 80 Hz bump at 91 dB matches the distortion graphs’ second-order trace quite well. The massive spike at 120 Hz at a roughly 106 dB SPL level corresponds to the distortion graph. You can also see a fifth-order 200 Hz harmonic at just under 90 dB SPL. This harmonic information is added to the audio signal by non-linearities in the woofer. This information is not in the source audio.
If you’ve ever wondered why lower-quality drivers are easy to locate in a well-designed audio system, they add high-frequency harmonic content to the bass information your amp sends. You might think you should only get information below 80 Hz, but the woofer might produce high-amplitude harmonics above 300 Hz.
Distortion vs. Frequency vs. Drive Level
Among its glitches and fussiness, the Clio Pocket has an issue where it can’t export harmonic distortion data using the same frequency base as the fundamental. This limitation makes it difficult to analyze distortion other than by selecting a few specific frequencies. So, I combined data from all measurements at 30, 40, 50, 60, 80, 100 and 120 Hz into the graph below.
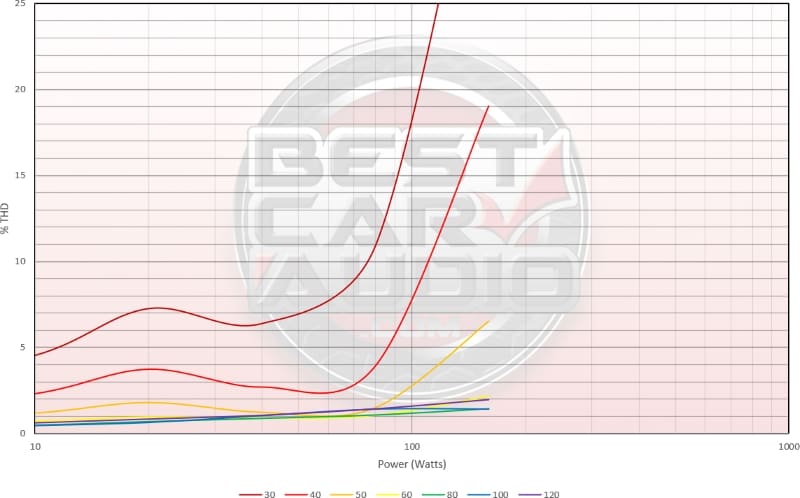
The horizontal scale in the chart above shows power. The vertical scale shows percentage distortion. The different traces represent different test frequencies. This graph highlights how driver excursion and distortion are correlated. Not much changes above 60 hertz as power increases. However, at 50 Hz, over 40 watts (shown as 80 watts), things start to get hairy. At 40 Hz, distortion never dips below 2%. Finally, at 30 Hz, distortion is never below 4% and exceeds 10% at power levels above about 75 watts (36 watts into this 8-ohm driver).
Conclusions on the Power Pro Audio A1010B
First, we apologize for this being an 8-ohm driver. That adds confusion to all the measurements. This speaker is more intended as a replacement woofer in an inexpensive home speaker. However, all the surplus stores we’ve seen have them labeled as subwoofers on their price tags. It might do reasonably well if you wanted to use this speaker as a midbass driver and play it from 60 to 300 Hz with no more than its rated 100 watts of power. That distortion peak at 230 Hz is manageable, given the price point. Playing this below 60 Hz with any reasonable power as a subwoofer upsets it quickly. The free-air resonance (Fs) is too high, and there isn’t enough excursion capability to get loud without sounding harsh. So, we conclude that it’s an inexpensive woofer, not a subwoofer. No surprise! Next, we check out an entry-level name-brand subwoofer from the early ’90s.
