Professional technicians have several options available to analyze audio signals. We can use an oscilloscope to look at the amplitude of a signal in the time domain. We can use a real-time audio analyzer to look at signals in the frequency domain. Thanks to the power of modern computers, we can combine both measurements to create a spectrogram to look at audio amplitude and frequency simultaneously. This article will explain a spectrogram and how to interpret its data.
Time-Domain Measurements
Before we dive into the spectrogram, let’s back up and look at the other two signal analysis tools. An oscilloscope has been a staple around car stereo shops for decades. This tool allows a technician to look at waveform amplitude relative to time. It’s most useful with fixed-frequency tones but also with dynamic information or digital signals. When in-vehicle navigation systems needed hardwired vehicle speed information, a scope was one of the only tools to tell us when we had the correct wire.
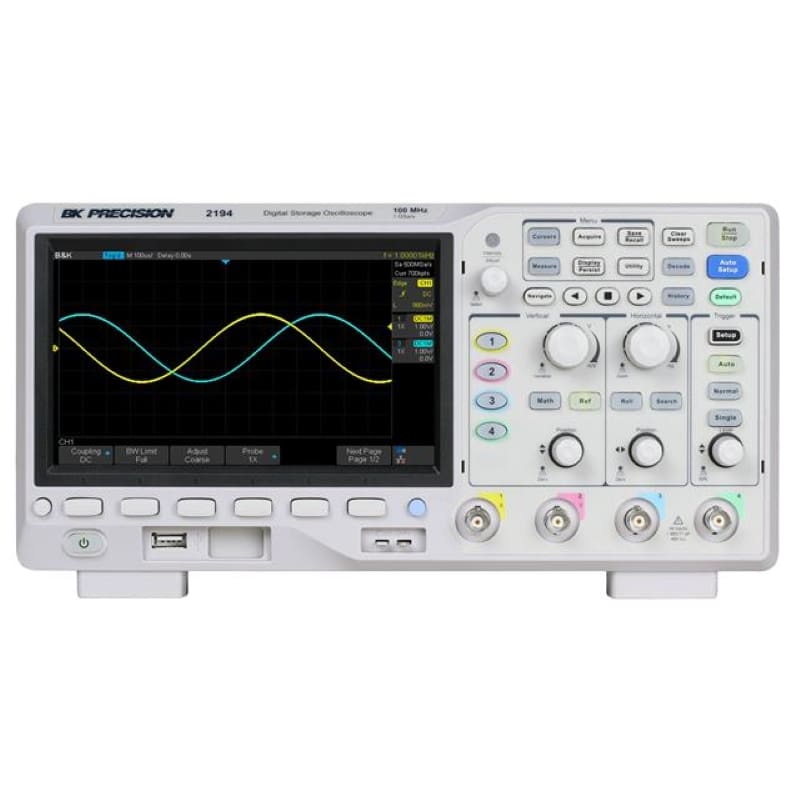
Most shops will use a scope to measure voltages from a source unit or amplifier to quantify their maximum output capabilities. One area where this measurement process often fails is the inability to measure frequency response easily. If a technician measures the maximum clean output at 40 Hz or 1 kHz, and the system has any equalization, it may produce more voltage elsewhere, rendering the measurements useless.
Check out our Tools of the Trade article to learn more about how an oscilloscope works.
Real-Time Audio Analyzer
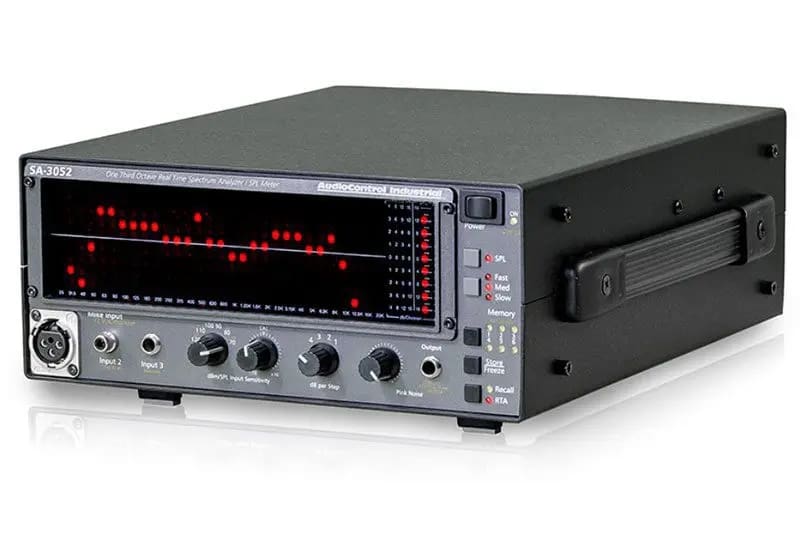
Another essential tool for car audio technicians is a real-time audio analyzer. Like a scope, it measures amplitude. Unlike a scope, an RTA displays amplitude relative to frequency rather than time. An RTA tells us how loud different frequencies are relative to one another or a reference like the dB SPL scale. We use this to adjust equalizers, but an important step precedes specific voltage measurements with an oscilloscope. Many stand-alone and computer-based RTA solutions are available to help technicians deliver better-sounding car audio upgrades.
Check out our Tools of the Trade article to learn more about how an RTA works.
What Is a Spectrogram?
What if we could use computer software to capture amplitude information like an oscilloscope and look at the frequency content of that information like an RTA? Well, we can. This is called a spectrogram. Computer-based audio analysis software like JL Audio’s MAX and Rational Acoustics’ Smaart can generate a spectrogram in real-time. Software like Room EQ Wizard and Adobe Audition can analyze an audio file and create a spectrogram from the information.
Here’s an example of a spectrogram of the children’s song “Row, Row, Row Your Boat” played on a piano.
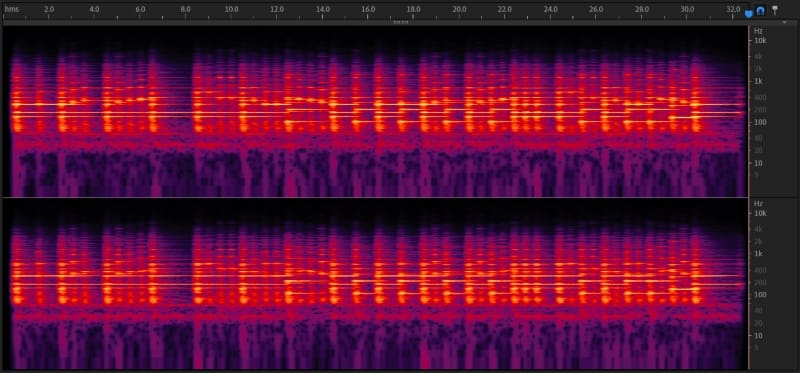
We can extract a few pieces of important information from this spectrogram. Before we do that, we need to understand what we’re looking at. The horizontal scale in this image is time. It starts at 0 seconds and ends at 32.7 seconds. Look at the very top of the picture. The numbers from 2 to 32 are seconds in this example.
The vertical scale is frequency. In this example, frequency is displayed logarithmically. The logarithmic display format means the space between 100 and 1,000 hertz is the same as between 1,000 and 10,000. Looking on the far right, you’ll see the numbers from 5 at the bottom to 10 kHz at the top. This is the frequency scale.
The last thing to look at is the colors on the graph. Black represents an absence of information. Pink and violet represent very quiet sounds. Red and orange are moderately loud sounds. Finally, yellow is the loudest or highest amplitude sound.
Let’s use this information to break down what’s happening in this simple track. We’ll zoom in to the first part of the song and add some labels to the image to help you see what’s going on.
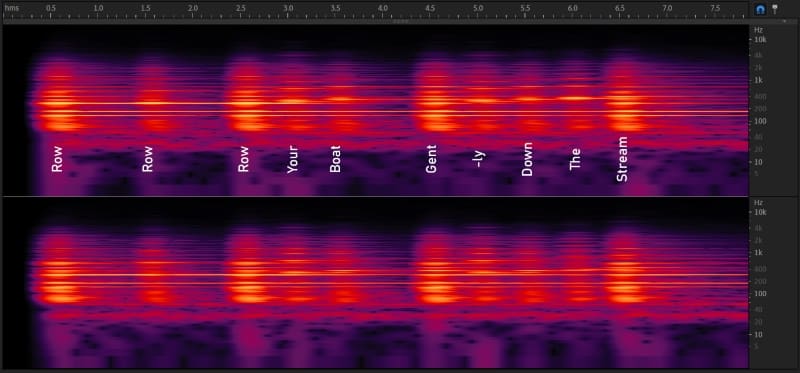
We can see the frequency of the notes played on the piano and how they accompany the words that would be sung as the song progresses. To be clear, there are no vocals in this recording – only the piano. The song starts with a two-key chord with roughly 130 and 167 hertz notes. Those equate to the C3 and E3 notes on the piano. A 262 hertz or C4 note plays simultaneously to align with the first repetition of the word Row. We can see the harmonics of the notes played as slightly lower amplitude yellow blobs at multiples of the fundamental frequencies.
The second repetition of the word Row has the same notes but has been played at a slightly lower amplitude, as shown by the decrease in yellow around the notes. The third repetition at 2.5 seconds is louder again, followed by a D4 note at three seconds and an E4 note at 3.5 seconds to accompany the words Your and Boat. The examination finishes with the pianist playing the left-hand C3 and E3 chords with the right hand playing E, D, E, F, and G to coincide with Gent, -ly, down, the, and stream. A spectrogram lets us see any audio waveform’s frequency versus time versus intensity. Essentially, it’s a three-dimensional map of the sound.
What Use Is a Spectrogram?
So, why would a car audio technician want to use a spectrogram to analyze what they are hearing? Audio measurement equipment can only tell you what it measures. It can’t decide if that is pleasant, wanted or accurate. Let’s say you’re a technician, and you’ve finished calibrating the time alignment and equalization in a car audio system with a digital signal processor. Most technicians finish the process with a listening evaluation to ensure that everything comes from the correct locations and there aren’t any unwanted buzzes or rattles in the vehicle. Audio measurement equipment can’t easily capture the latter information.
If they hear a note that’s too loud, they can look at the spectrogram to pick out the note’s frequency, then decide if it needs attenuation, if it’s speaker distortion or some other issue. Spectrograms are an excellent tool for correlating sounds to specific frequencies.
Audio Analysis Tools Improve Car Audio Systems
If you’ve chosen to partner with an expert mobile enhancement retailer to upgrade the sound system in your vehicle, you’ll likely notice that they have a lot of tools at their disposal. Aside from fabrication and hand tools, audio analysis tools let them measure aspects of sound systems to ensure that what they deliver to you sounds the best it can. Picking shops with these tools and understanding how to use them properly is all part of choosing the best retailer to work on your vehicle.
