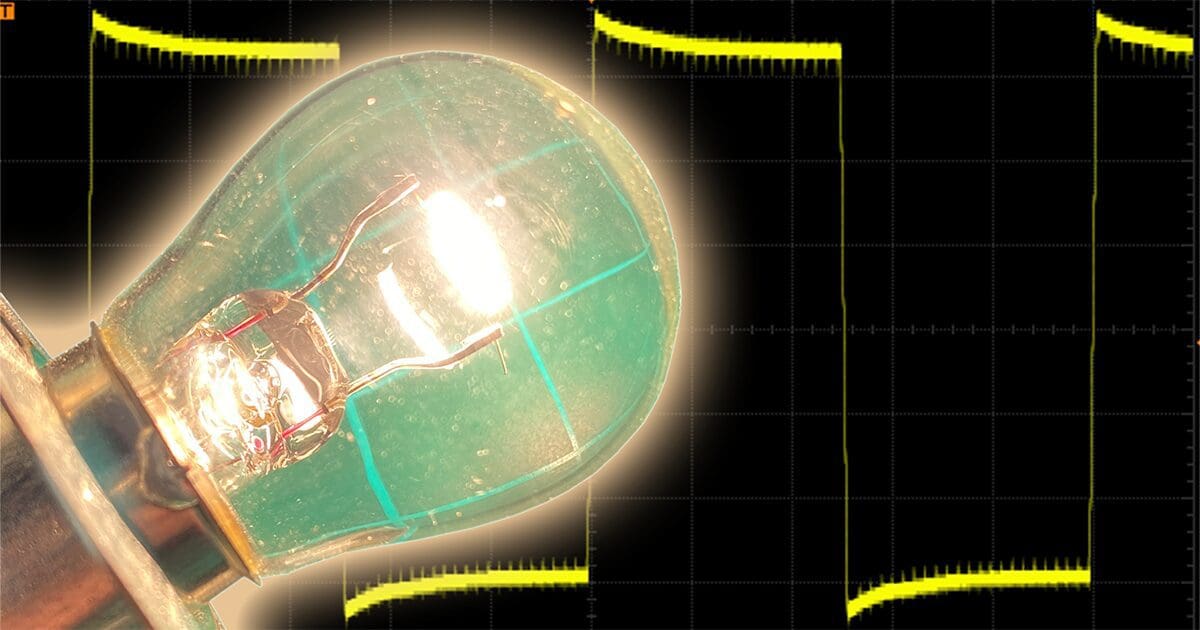
We recently published a detailed article explaining what happens when an amplifier starts to clip. The article detailed the inclusion of harmonics in the output signal and explained how this extra high-frequency information increases the power to a speaker. Regarding damaging speakers, the issue isn’t specifically the harmonics, as many electric guitars produce similar waveforms when used with distortion pedals. Instead, the problem is that more power is sent to a speaker, resulting in overheating it. In this article, I’ll present you with an easy-to-understand, real-world example of how amplifiers produce more power when pushed into clipping.
Things You Need to Know about Amplifier Clipping
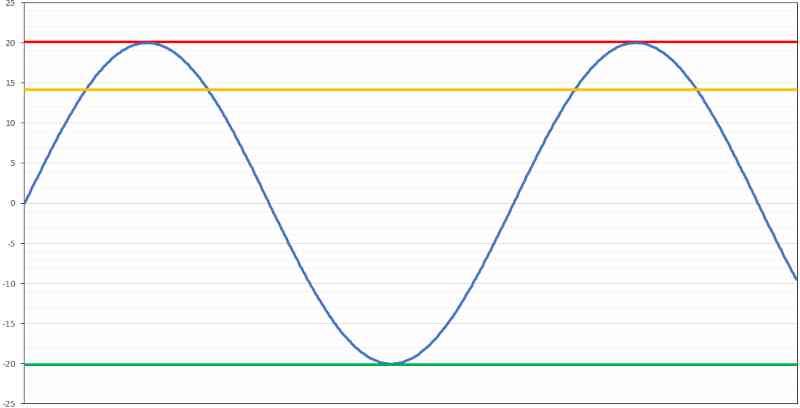
We calculate the effective energy level in the waveform with a sine wave by dividing the peak amplitude by the square root of 2. If the waveform is 40 volts peak-to-peak and consequently 20 volts peak, the RMS value would be 20 ÷ √2, which is 14.14 volts. We call this the RMS (root mean square) level, and it’s an amplitude that’s equivalent to a DC voltage that can do the same amount of work. To be clear, if you have a small heating element and you send it 14.14 volts DC, it will produce the same amount of heat as an element powered with a sine wave with an RMS level of 14.14 volts.
What happens when we increase the signal’s amplitude going to the amplifier or turn up the gain on the amp? In our example, we can’t exceed plus or minus 20 volts. So, the signal becomes distorted with the inclusion of odd-ordered harmonics. With enough harmonics present, the amplifier output waveform takes the shape of a square wave.
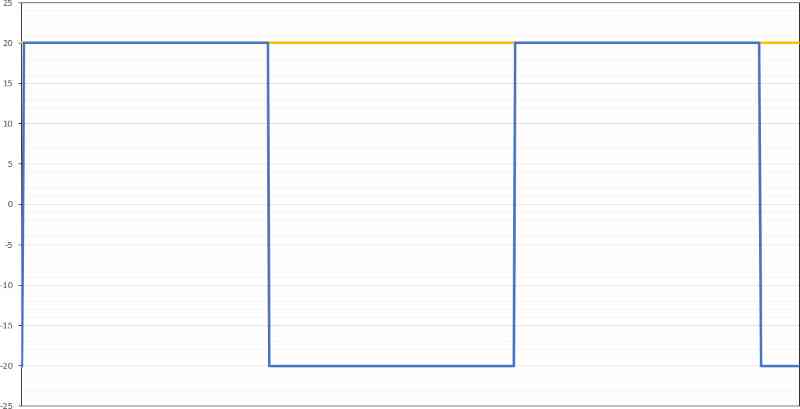
If you look at the yellow trace above, you’ll see it’s equal to the peak voltage of 20 volts.
If you want a detailed analysis of amplifier clipping, check out my article on the myth of distortion damaging speakers. In summary, harmonics are produced when an amp is driven with a signal that requires more voltage than the amp can supply. This harmonic content contains significant amounts of power and can dramatically increase the energy delivered to a speaker.
Calculating Power in Audio Signals
For steady-state audio signals, the formula to calculate power is voltage squared divided by resistance. For AC signals, we use the RMS voltage. So, in our first example, we’d have (14.14 x 14.14) ÷ 4, which is 50 watts.
For the second example, we have a square wave, and the voltage we use is the peak level, which is 20 volts. So, (20 x 20) ÷ 4 is 100 watts.
In theory, if you overdrive your amplifier enough to produce a square wave, it can produce twice as much power as a clean sine wave. This extra power translates to twice as much heat produced in the voice coil, which can quickly lead to damage. Sadly, this extra power doesn’t necessarily translate to more output from a speaker as the added energy is found in the harmonics at higher frequencies than the stimulus signal. If you’re trying to reproduce a 55-hertz bass tone, having large amounts of energy going to the sub at 165 hertz, 275 hertz, and so on isn’t much use.
Visualizing Power Delivery
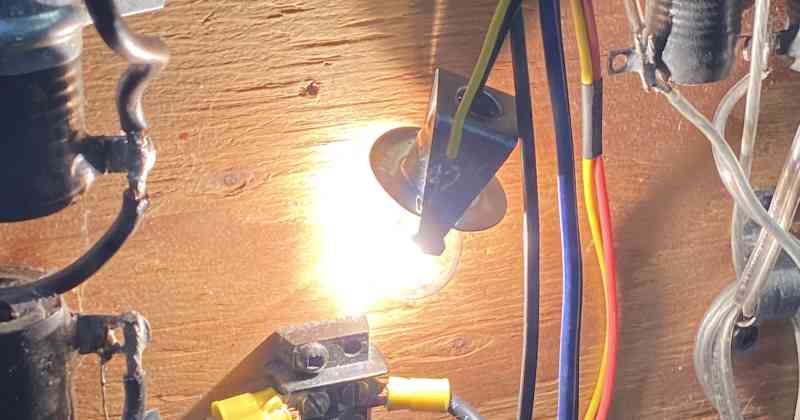
It’s easy for me to do a bunch of math and make spreadsheets to explain that including several octaves of harmonics increases the power sent to a speaker. However, I thought of a better way to show this. I’ve got a standard incandescent 1157 automotive brake light bulb in a holder. Because the amplifier I’m using for this example doesn’t produce a significant amount of voltage, I can use this bulb to demonstrate the power it is producing at different output levels.
The image below is the bulb intensity with the amp producing 1% total harmonic distortion, or what those in the industry would describe as “full power.”
Here’s the waveform going to the load resistor and light bulb as seen by the oscilloscope.
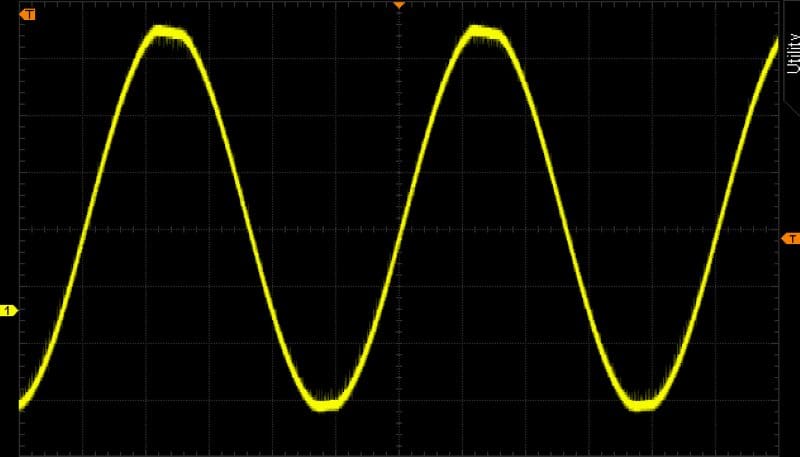
Finally, here’s the spectral content of the signal going to the bulb as measured by my Quant Asylum QA403 audio analyzer.
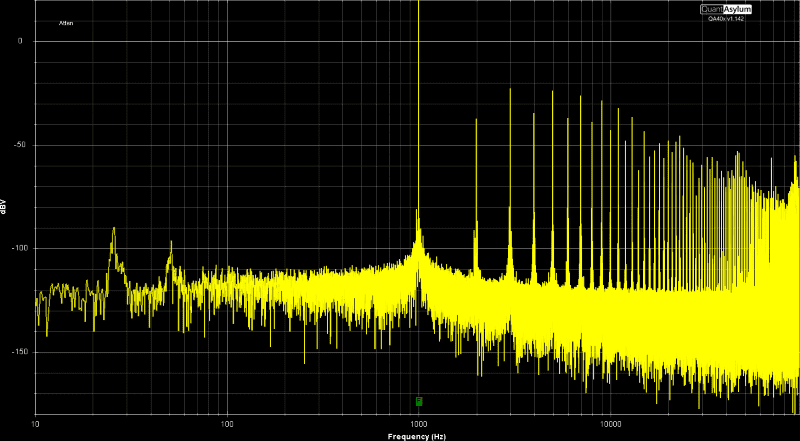
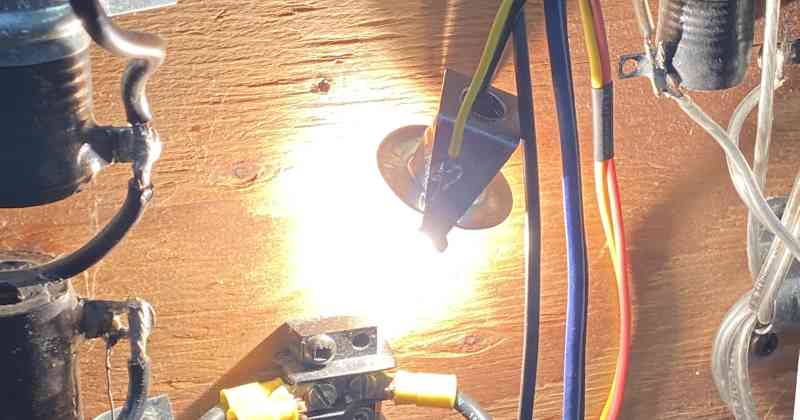
Next, I’ll turn the gain control up on the amplifier to add a whole slew of harmonic content. You can easily see how much brighter the bulb becomes. As a note, I set the AE lock on my iPhone for this picture, then used that setting to take a picture of the output with the sine wave. No Photoshop trickery here!
Here’s the waveform going to the load resistor and light bulb as seen by the oscilloscope.
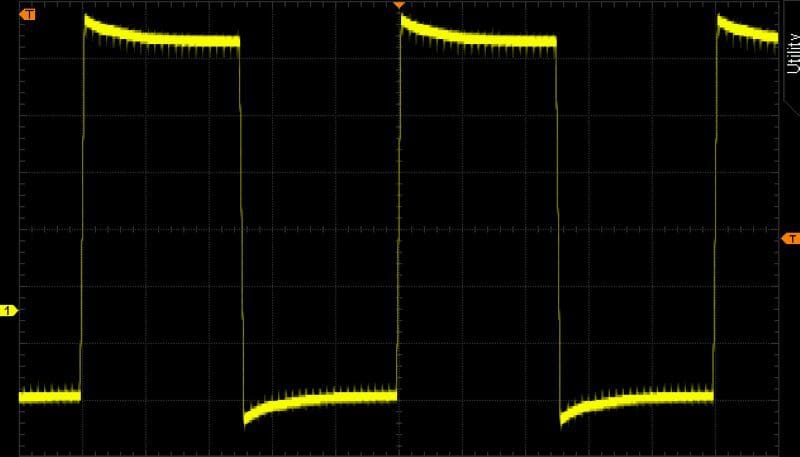
Finally, here’s the spectral content of the signal going to the bulb as measured by my Quant Asylum QA403 audio analyzer.
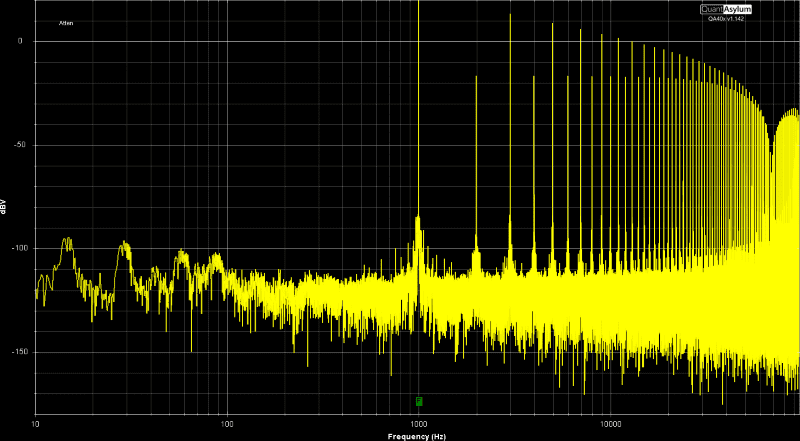
It’s easy to see that the bulb is much brighter. That’s all you need to know. More distortion means more power. In the case of a light bulb and a speaker, that translates to more heat. Sadly, as mentioned, it doesn’t translate to your music sounding better. It might be a touch louder, but it will definitely sound horrible.
If you wonder why a 40-watt amplifier can damage a speaker rated for 50 watts, this is one of the reasons. The second reason is based on how speakers are rated. That monster article on distortion and speaker damage explains that process in detail.
