 I’ve heard people in the industry say that most amplifiers, operating in their linear range, sound the same. I’ve tested hundreds of amplifiers over the years, and while some were very similar, I can confidently say that I’d never have described two of them as sounding identical.
Those of us in the car audio industry want you to have the best-sounding car audio system you can afford. While everyone has personal preferences about how their system is tuned, particularly concerning balancing bass to midrange and high-frequency output, two things that remain a constant across all systems are a desire for clarity and lack of background noise. These two criteria, in most situations, are what differentiate the mediocre electronic products from the great ones. In this article, we’ll talk about how and why “better” products offer improved performance and we’ll demonstrate exactly why it’s unlikely that no two amplifiers sound the same (unless they are the same make and model of amp).
What Is Clarity?
 Clarity is defined as the quality of being easy to see or hear. Think of your view out the windshield of your car or truck. If there’s dirt on the window, the image won’t be clear. The same goes for your glasses. Removing these unwanted obstructions makes the image clearer. In audio terms, clarity refers to a lack of noise or distortion that masks the original signal.
It’s also a concept that many companies overlook when designing audio products. Recreating recordings without adding unwanted information in the form of harmonic or intermodulation distortion is the key to achieving great sound. Every electronic device or speaker creates some amount of distortion. Implementing thoughtful designs and features that reduce distortion is what separates the mediocre from products that are great.
High-Quality Amps Add Less Distortion
All electronic audio products add various amounts of distortion to the audio signal that passes through the device. We quantify this distortion by looking at the peak amplitude of the highest harmonic, relative to our test signal, and we use the specification known as signal-to-noise ratio to describe the phenomenon. Let’s look at an example to describe this specification. A hypothetical amplifier has a published S/N ratio of -76 dB with the qualifications that the measurement is A-weighted, analyzed from 20 Hz to 20 kHz and is referenced to 1 watt of output into a 4-ohm load.
Let me explain what those qualifications mean. Working backward, this specification describes an output level of 2 Vrms from the amplifier. 2 Vrms equates to 1 watt of power into a 4-ohm load – two times two, divided by four.
Next, the test equipment will analyze the noise content across the audible audio spectrum, including all frequencies from 20 Hz through to 20 kHz. The A-weighting scale is a derating curve that is used to approximate the sensitivity of human hearing. Essentially, our hearing is most sensitive around 1 kHz and less so at higher and much lower frequencies.
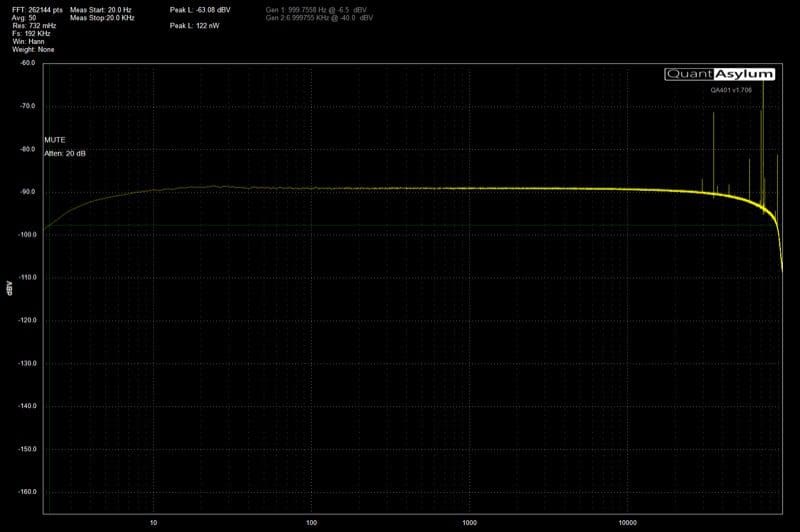
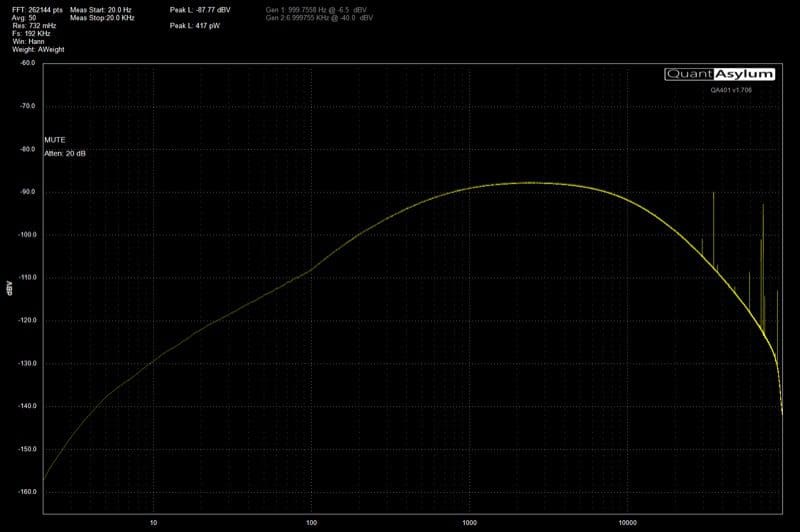
Finally, the specification of -7 6dB means that the noise produced by the product is at least 76 dB quieter than the 2-volt output signal. If you do the math, the noise produced has a voltage of 0.317 millivolts. That seems pretty low in terms of an absolute number. Keep in mind, our audio systems are capable of producing sound pressure levels (volume levels) that exceed 120 dB, so this noise can be quite audible.
Real-World Measurements
 For this article, we are going to examine the distortion and noise characteristics of three amplifiers. I happen to have several high-end amplifiers here in my lab as well as a few consumer-level products. I searched far and wide to find a third amp for this test that most in the industry would consider being of below-average quality. My goal is to help quantify the importance of premium products. I will label the subject amps as Amp A for the low-quality one, Amp B for the mid-level and Amp C for the high-end solution.
Amplifier Noise and Distortion Testing
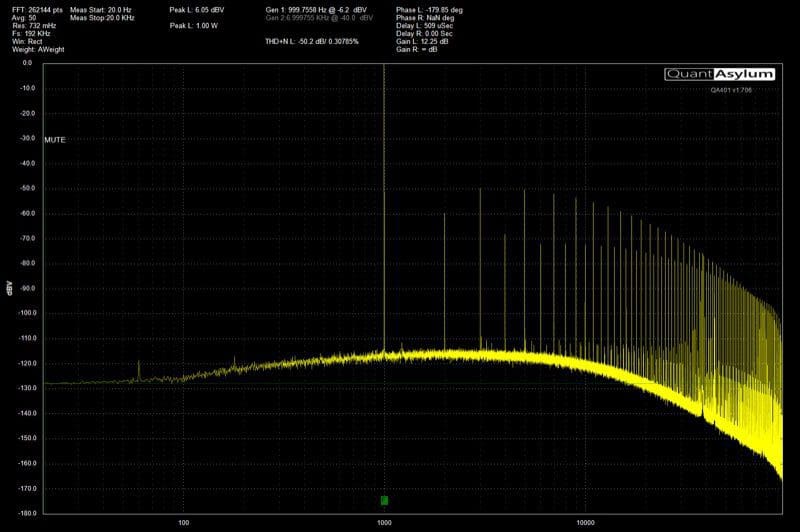
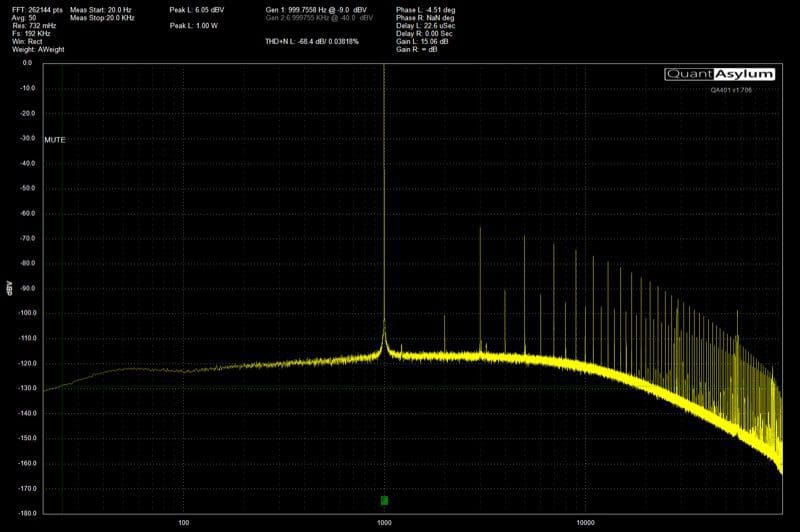
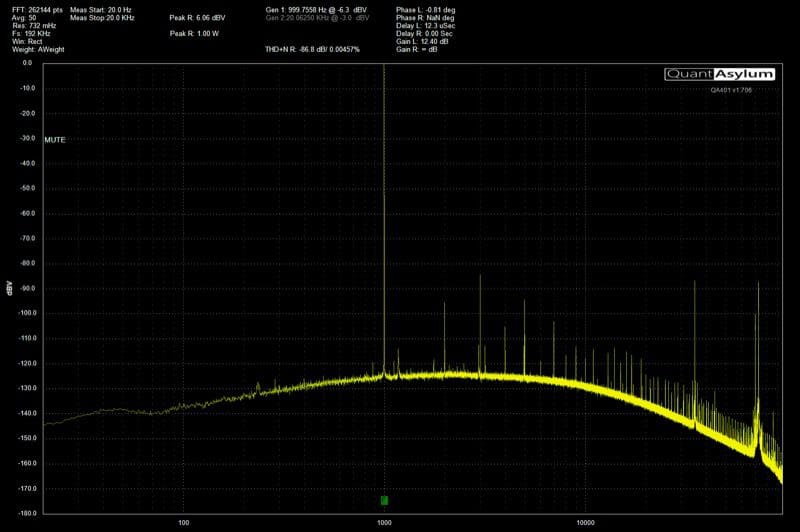
The input signal for this test is a 1 kHz sine wave. I set each amplifier so that it would produce 2 volts RMS of output, which equates to 1 watt of power. This test complies with the S/N ratio testing criteria as outlined in the CTA-2006-B specification.
Understanding the Numbers
 The amount of noise added by a product is a good measure of how much care was put into the design of the device and its circuitry. You can see that the background noise levels of amplifiers A and B are 7 or 8 dB louder than that of Amp C. You can also see just how much harmonic distortion is created by amplifiers A and B relative to C when playing a single 1 kHz tone. Imagine how much extra content would be created when music is playing, and there is audio information from 20 Hz to 20 kHz. Harmonic distortion is as relevant at low frequencies as it is within the mid- and high-frequency ranges.
 The next time someone tells you all amplifiers sound the same, you can refer them to this article as undeniable proof that different amps produce different levels of harmonic distortion that will change the way the amp sounds. Even-ordered harmonic distortion is responsible for that “warm” sound some use to describe devices. Ideally, you don’t want any distortion at all. Your music should be as pure and accurate as possible.
The next time you are at your local specialist car audio retailer, look for the CEA-2006- or CTA-2006-compliant S/N ratio tests and choose an amp that offers the power, features and best noise performance that you can afford.
