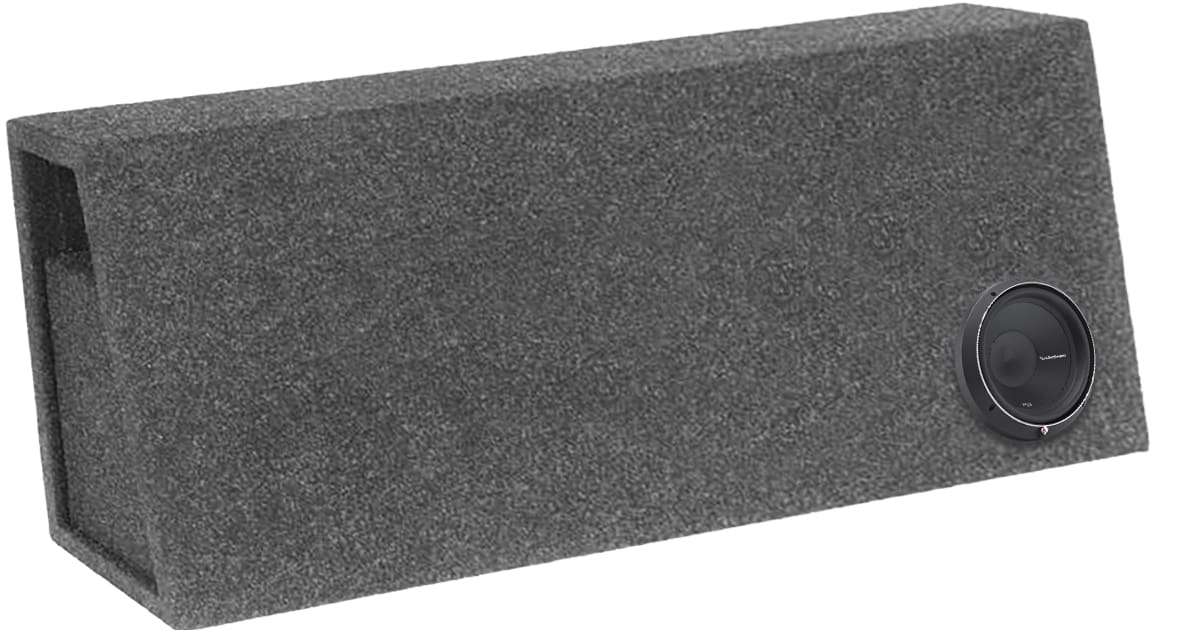
What happens when a subwoofer is used with an oversized subwoofer enclosure? This article will look at the good, the bad and the ugly in terms of an improper match between the electromechanical characteristics of a subwoofer and the need for a proper enclosure.
Why Do Subwoofers Need an Enclosure?
If you’ve been following our series of articles on understanding subwoofer quality, then you’ll know that the purpose of a subwoofer enclosure is to act as a mechanical high-pass filter. That’s right: The enclosure limits how much low-frequency information a subwoofer produces. Why? Well, below about 250 or 300 Hz, a speaker cone has to move four times as much for every octave lower it plays. Put another way, if you have a subwoofer playing a 100-Hz tone and it’s moving 0.25 mm, it needs to move 1 mm to produce the same output at 50 Hz, and 4 mm to produce the same result at 25 Hz. It would theoretically have to move 16 mm to make the same output at 12.5 Hz.
Why is cone excursion a problem? Well, the suspension components (surround and spider), along with the length of the voice coil and thickness of the top plate, determine how far the cone can move linearly. Linearity is vital because distortion skyrockets when things get non-linear. Think of this like mechanical clipping. It can sound just as bad as an amplifier that’s clipping. In extreme cases, mechanical components of a speaker crash into each other, which can cause damage.
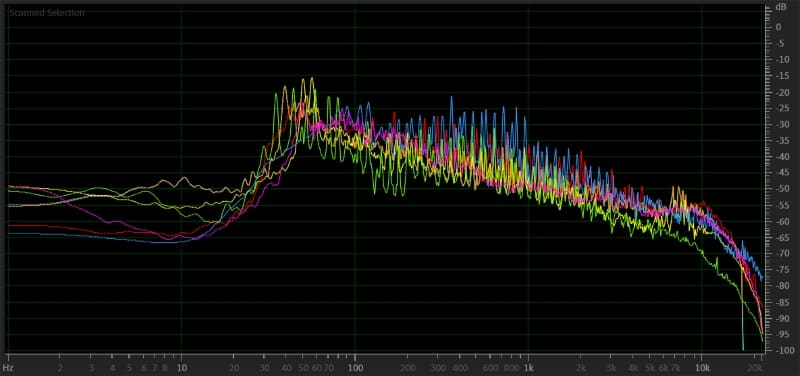
If you’ve ever analyzed the frequency content of popular music, you’ll know that most of it has very little audio information below 35 Hz. The chart below shows the frequency content of several songs. The trace in red is “Dance the Night” by Dua Lipa. The orange trace is “Industry Baby” by Lil Nas X feat. Jack Harlow. The yellow trace is “Paint the Town Red” by Doja Kat. “Slime You Out” by Drake is in green. “Clocks” by Coldplay is in blue. Finally, the violet trace is “I’m Shady” by Eminem. There is nothing below 35 Hz of significance in any of these tracks. That’s not to say that some music doesn’t contain significant amounts of deep bass and even infrasonic information – it’s just less common than you think.
If we can control how much the speaker cone moves at very low frequencies, we can apply a lot of power to a speaker around and above 35 Hz so it will play loudly while preventing the speaker from bottoming out. An infrasonic filter, often mistakenly called a subsonic filter, does the same thing. The electrical filter has one huge benefit: It eases the load on the amplifier, the vehicle’s electrical system and the thermal power handling requirements of the subwoofer.
A Quick Comparison of Acoustic Suspension and Bass Reflex Subwoofer Systems
Two popular types of subwoofer enclosures are used in car audio systems: acoustic suspension (sealed) and bass reflex (vented or ported) designs. An acoustic suspension enclosure is a simple sealed cabinet. The math that predicts the frequency response and excursion of the subwoofer is relatively simple, and the performance is predictable. Notably, there’s no significant change in performance if the volume of an acoustic suspension enclosure varies slightly from the specifications. A bass reflex enclosure is typically larger and includes a vent (or port) of a specific area and length to create a resonating system. At its resonant frequency, most of the sound from the enclosure comes from the vent, and the subwoofer cone moves very little. This is why using a large enough vent with proper radii on both ends is crucial.
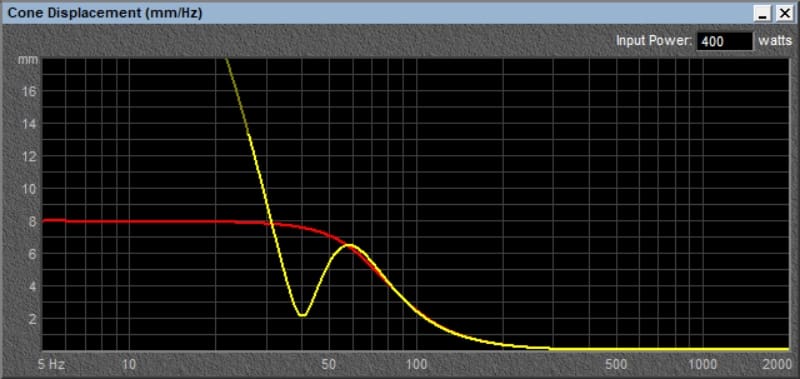
The traces in the above image are very typical in terms of this comparison of sealed and vented enclosures. The red trace is the sealed enclosure with a net volume of 1.02 cubic feet. We can see that the low-frequency cone excursion plateaus below 50 Hz. Why? The compliance of the air inside the enclosure adds to the compliance of the subwoofer’s suspension to limit motion. In short, the suspension becomes stiffer.
The yellow trace represents a vented enclosure with a net volume of 1.79 cubic feet and a vent tuned to 40 Hz. Around 60 Hz, the cone excursion on the vented enclosure is slightly higher. This increase happens because the enclosure is larger. Around the tuning frequency of 40 Hz, the woofer cone barely moves. The graph below shows the velocity of the column of air in the vent at the same 400-watt drive level.
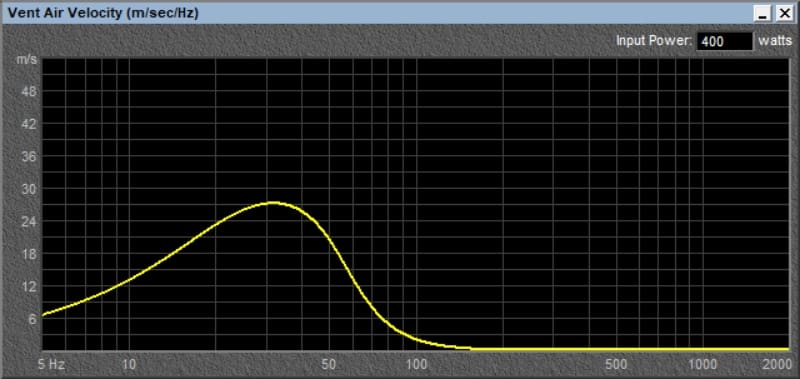
The yellow trace shows us that the vent’s air column moves the most at 40 Hz. This makes sense, as this small area produces most of the sound from the enclosure at this frequency.
How Acoustic Suspension Enclosure Volume Affects Response and Excursion
Let’s start looking at how changes in enclosure volume affect frequency response and cone excursion. Considering both of these criteria is crucial since the enclosure’s purpose is to prevent our subwoofer from bottoming out.
Let’s use a roughly 25% variance in enclosure volumes so that the differences in performance are clearly visible. All drivers can work within a range of volumes, so 10% either way just isn’t going to make a huge difference.
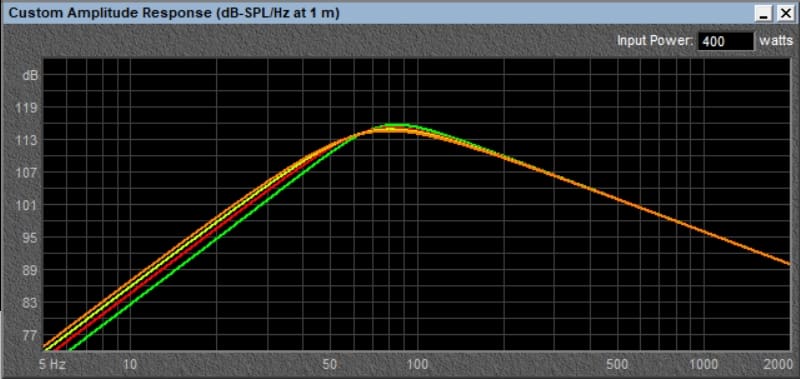
In the graph above, I’ve modeled the predicted response of a Rockford Fosgate Punch P2D2-12 subwoofer, which is in the BestCarAudio.com lab for an upcoming Test Drive Review. The red trace is our 1.02-cubic-foot enclosure that matches the acoustic suspension enclosure suggestion on the Rockford Fosgate website. The green trace is a 0.75-cubic-foot enclosure. As expected, using this enclosure reduces output below 65 Hz and increases the resonant peak up to around 80 Hz. Going the other way, we have a 1.25-cubic-foot enclosure in light green and a 1.5-cubic-foot enclosure in orange. The increase in low-frequency output below 65 Hz isn’t significant, which tells us the driver’s suspension plays a more substantial role in cone control.
Regarding outright “accuracy,” the larger enclosures have a lower total system Q. This value is called the Qtc. Lower Qtc values correlate to less resonance and, consequently, tighter sound. The 0.75-cubic-foot enclosure has a Qtc of 0.976, which is considered high. The “optimized” 1.02-cubic-foot enclosure has a Qtc of 0.881, which is still on the high side but gives us a good upper bass kick with some added efficiency. The 1.25- and 1.5-cubic-foot enclosures have Qtc values of 0.826 and 0.781. Many consider a Qtc of 0.707 to be the ideal Q-factor. In reality, it’s a good balance of efficiency and damping. The ideal Qtc is 0.5, but an enclosure with enough volume to produce that value can result in excursion issues. The Qts value of this subwoofer is 0.52, so it’s impossible to get a Qtc value lower than that.
Speaking of excursion, let’s look at a comparison of cone excursion versus frequency for our four sealed enclosures.
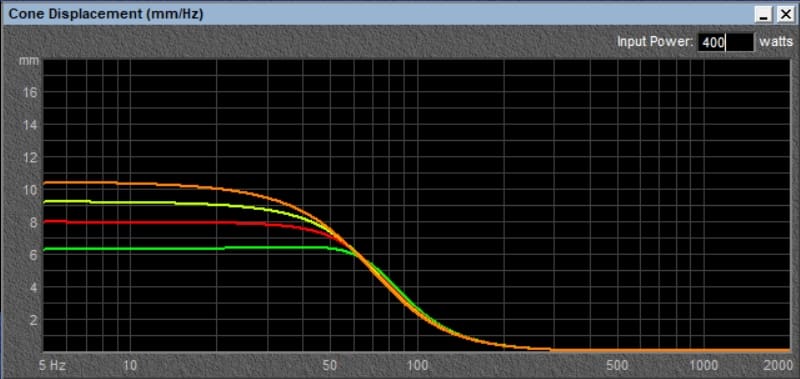
As expected, the larger enclosures allow the woofer cone to move more at lower frequencies. Fortunately, this subwoofer has an Xmax specification of 13.3 mm, so we don’t run into any issues at any frequency at this power level.
Let’s look at an extreme comparison of sealed enclosure volumes.
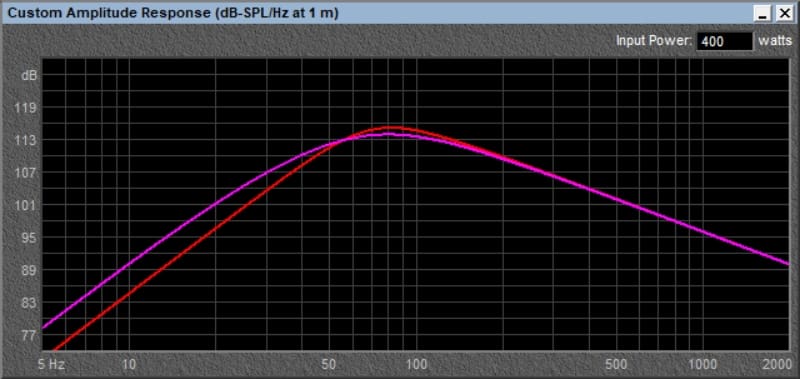
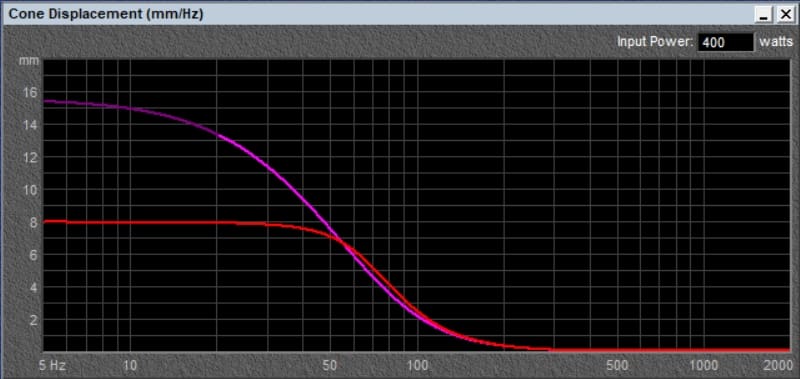
The graphs above show the 1.02-cubic-foot enclosure predicted response in red and the subwoofer’s response in a 3.0-cubic-foot enclosure in violet. Larger enclosures mean more output at lower frequencies. This massive enclosure produces 3.3 dB more output at 30 Hz. That’s not a huge gain, but it represents an increase similar to what you’d hear if you could provide the subwoofer with twice as much power.
We do run into a problem, though. At frequencies below 20 Hz, the driver will exceed its 13.3-millimeter Xmax specification. A nice shallow -6 dB/octave infrasonic filter set to 20 Hz would protect this driver from damage should your music contain audio below 20 Hz. Your installer would have to use a DSP to configure an infrasonic filter like this.
Bass Reflex Enclosure Volume Comparisons
Let’s look at bass reflex enclosures with the same Rockford Fosgate P2D2-12 driver. We’ll start with the 1.79-cubic-foot suggested enclosure as our reference, then go up and down by 25% while maintaining the same 40-hertz tuning frequency.
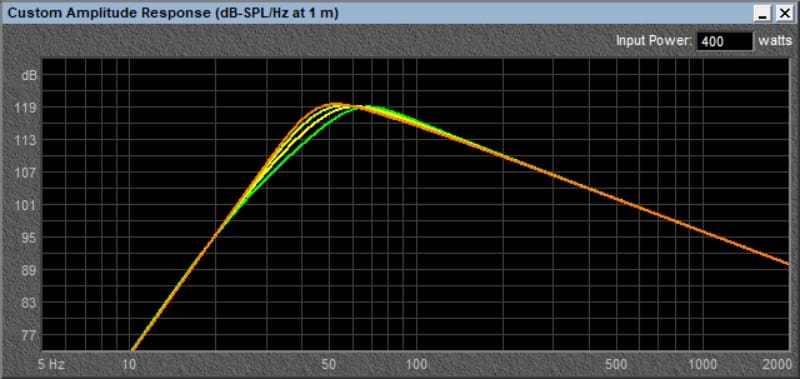
In the chart above, the yellow trace is our reference 1.79-cubic-foot enclosure tuned to 40 Hz. The green trace represents an enclosure volume of 1.35 cubic feet, the light green trace is 2.24 cubic feet, and the orange is 2.68 cubic feet. The results show that the system’s peak output frequency moves closer to the tuning frequency as volume increases. Let’s look at the vent air velocity graph to see if it corroborates this hypothesis.
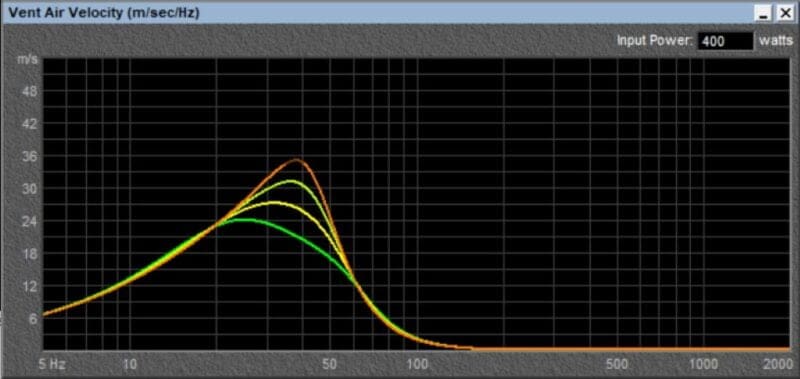
The maximum vent air velocity frequency moves closer to 40 Hz as the enclosure volume increases. It’s worth noting that the 4-inch diameter vent isn’t suitable for the largest volume enclosure as the velocity exceeds 34.5 meters per second. The vent must be larger and subsequently longer to function correctly with this enclosure volume. Analyzing vent air velocity is another crucial part of subwoofer enclosure design.
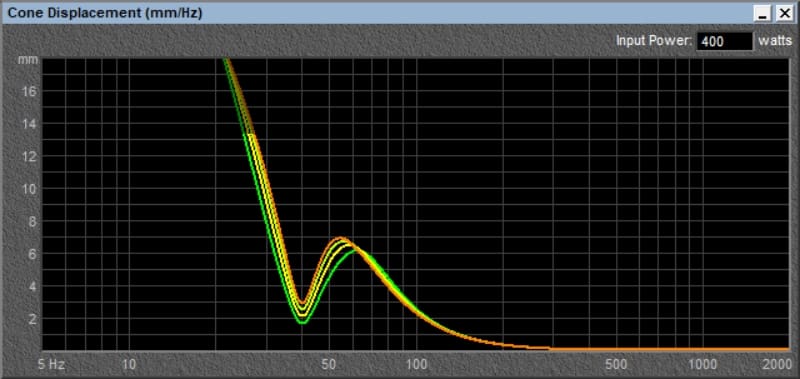
It should be no surprise that the larger enclosures provide less control over woofer cone excursion. Fortunately, the high tuning frequency controls cone motion around 50 to 60 Hz. Below the tuning frequency, we need an infrasonic filter set to 27 Hz for the largest enclosure to keep things under control at this power level.
Effects of Tuning Frequency on Output and Cone Excursion
We put woofers in larger enclosures to get them to play louder at lower frequencies. Let’s look at what happens if we change the tuning frequency of our reference 1.79-cubic-foot enclosure.
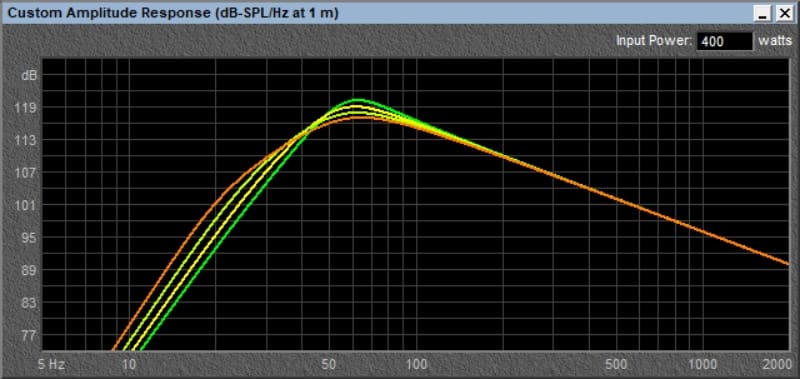
The chart above shows our reference enclosure of 1.79 cubic feet tuned to 40 Hz in yellow. The green trace is the same volume tuned to 45 Hz. The light green trace shows the enclosures’ predicted response when tuned to 35 Hz. The orange trace represents a tuning frequency of 30 Hz. There are no surprises here as we trade upper bass output for more output at lower frequencies.
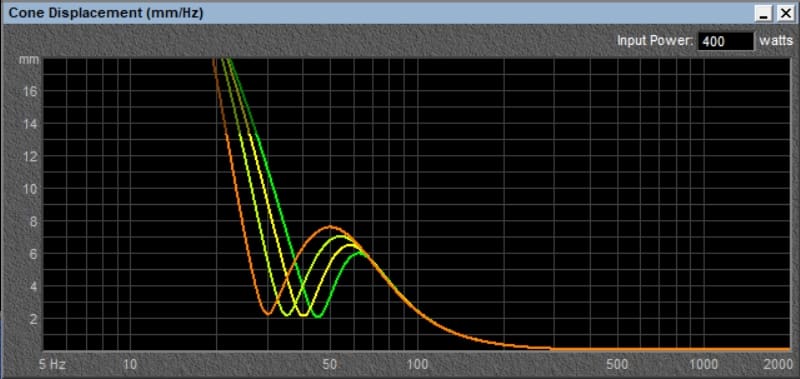
Once again, there are no surprises shown here. The dip in cone excursion aligns with the different tuning frequencies. We don’t have any excursion problems above the tuning, and an infrasonic filter will keep things safe at lower frequencies.
What happens if we combine smaller and larger enclosure volumes with different tuning frequencies? In this example, with the Rockford Fosgate subwoofer, things work out. But that’s not always the case.
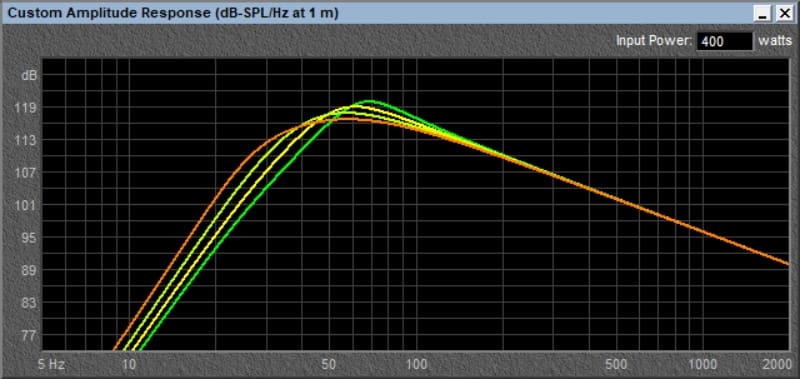
In the graph above, the yellow trace is our 1.79-cubic-foot enclosure tuned to 40 Hz. The green trace is 1.35 cubic feet tuned to 45 Hz. The light green trace is 2.24 cubic feet tuned to 35 Hz. Finally, the orange trace is 2.68 cubic feet tuned to 30 Hz.
Knowing that larger enclosure volumes focus the subwoofer system output around the tuning frequency, we should be able to get even deeper bass if we combine a larger enclosure with deeper tuning. Sure enough, the graph above supports this. The 2.68-cubic-foot enclosure tuned to 30 Hz would rumble! Driver excursion limits are very similar to the previous simulations.
Now, can we go too far with variances in enclosure volumes? What if someone doesn’t understand balancing speaker protection with frequency response and constructs a massive enclosure with a very low tuning frequency? Let’s look at that.
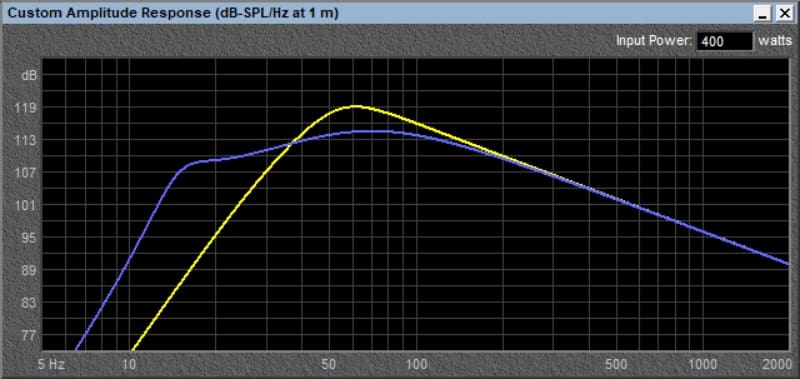
The massive 6-cubic-foot enclosure shown above is tuned to 17 Hz and has an F3 frequency of 24.5 Hz. On paper, this looks like a great home theater subwoofer enclosure. However, looking at the excursion graph shows us we have a problem. At 26.5 Hz, the massive enclosure isn’t controlling cone excursion. We are within a millimeter of the driver exceeding its limits. Remember from our subwoofer quality comparisons that distortion increases with excursion. So this solution likely won’t sound all that great, even if it produces lots of output at low frequencies.
Lesser subwoofers used in moderately large enclosures often encounter excursion issues above the tuning frequency. This is common with drivers with very compliant suspensions.
Proper Enclosure Modelling is Crucial
We see people on the internet “designing” subwoofer enclosures with free software daily. We love that enthusiasts want to experiment and build their audio systems. However, the instructions for the software don’t include knowing how to interpret the data these software packages deliver. You’ll find many expert mobile enhancement retailers who know how to combine enclosure designs with digital signal processing and the natural transfer function of a vehicle to deliver impressively compact and efficient subwoofer enclosure solutions that sound phenomenal and operate reliably.
So what happens when you put a subwoofer in an oversized subwoofer enclosure? Well, you might get more deep bass. You might get more controlled bass. You might run into excursion-based power handling issues and damage the driver. Thankfully, subwoofers from top-tier brands like Rockford Fosgate have a balance of suspension design and excursion capability, making them very flexible and resistant to enclosure design and construction errors. If you want the bass in your vehicle to sound the best it can, drop by a local specialty mobile enhancement retailer and have them design a custom enclosure that maximizes the available space in your vehicle and ensures that the subwoofers you’ve chosen will work well with your amplifier.
