As we continue to explain what makes one amplifier different from another, we’ll look at distortion in the context of power level and frequency. Unbeknown to most enthusiasts, how an amplifier behaves varies based on the frequency you ask it to play and how much power it produces. The latter is a crucial piece of information if you’re looking for an amplifier that will sound good with midrange drivers or tweeters. These small speakers don’t need much power to play loudly. As such, you’ll want an amplifier that produces a clean signal at low volume levels.
Examining Distortion Versus Frequency
Let’s start this discussion by considering the effects of harmonic distortion at different frequencies. In reality, this is a simple measurement. We want to characterize the quality and accuracy of an amplifier in bass, midrange and high-frequency ranges. We might find that an amp is clean in one range but has a design issue that would preclude or at least make us reconsider using it in another range.
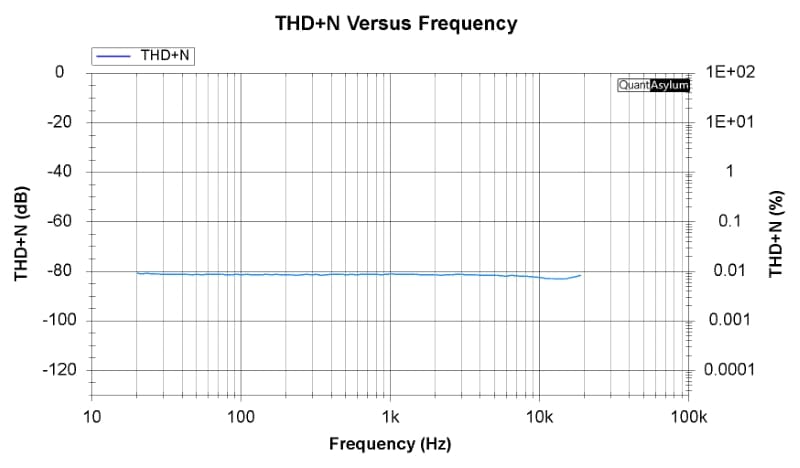
The graph above shows a high-quality Class D amplifier’s total harmonic distortion and noise. As you can see, the design is exceptional. There are no issues in any frequency range.
Let’s try something at the opposite end of the scale. The chart below is a graph of harmonic distortion and noise versus frequency of our reference “low-quality” amplifier. It’s big, colorful and terrible in every regard!
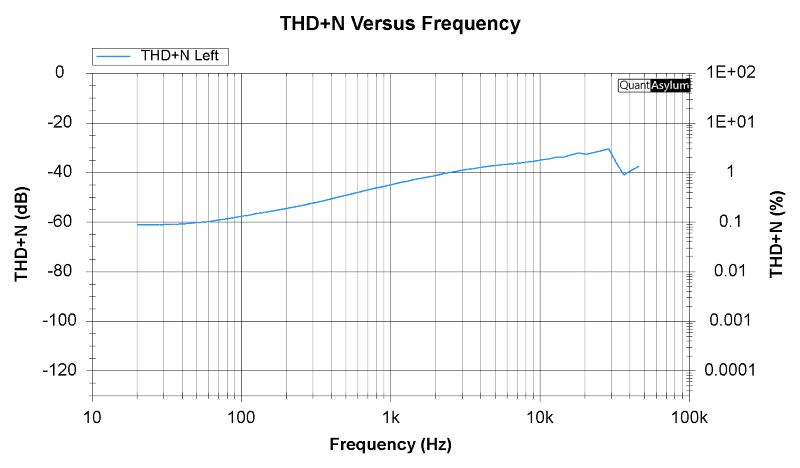
At 1 kHz, the frequency where most professional reviewers measure THD+N, this amp comes in at about 0.6 or 0.7%. That’s pretty atrocious in every way conceivable. This percentage measurement translates to an amplifier that adds harmonics that are only ~43 dB below each fundamental frequency. The good amplifier is at about -81 dB below each fundamental frequency. Now, let’s look at the higher frequencies. Above 1.5 kHz, there’s 1% THD+N; by 10 kHz, the distortion has reached almost 2%. If you want the high-frequency content in your music to sound really bad, this is the amp for you!
Distortion Versus Power Level
The second part of this amplifier distortion analysis will examine how distortion changes at different power levels. This measurement considers noise, so again, low-quality amplifiers won’t perform well on these tests.
The graph shows total harmonic distortion plus noise on the vertical scale, then power output into a resistive load on the horizontal scale.
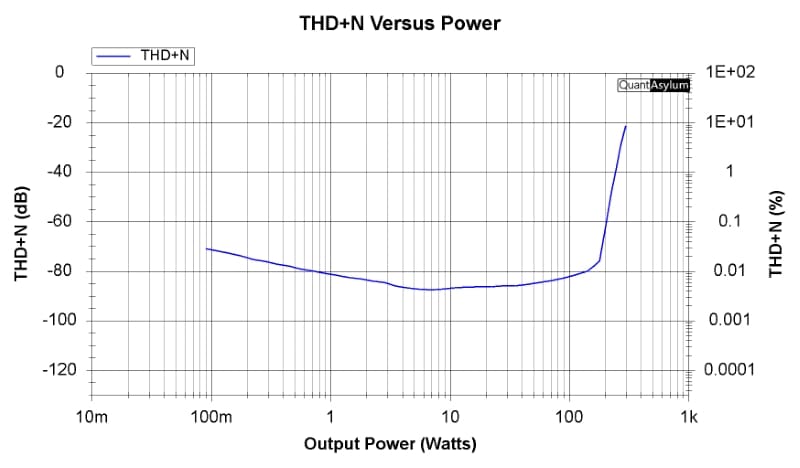
It’s very common to see measurements that are a bit higher on the left side of the graph. In this range, the background noise (also called noise floor) plays a more significant role in determining the THD+N number than the harmonic content. However, this amp behaves quite well through the entire power range.
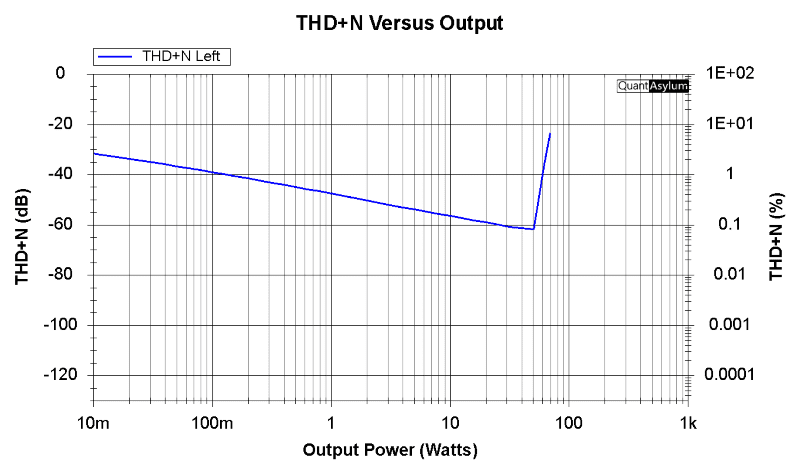
We have our low-quality Class AB amplifier at the opposite end of the spectrum. While it’s OK just before it starts clipping around 60 watts of power, down at low levels like 1 watt, or worse, 1 milliwatt, it’s a train wreck.
You’d think that 1 milliwatt isn’t an important output level. That’s not entirely accurate. If we take the average 6.5-inch speaker as having an efficiency of 85 dB at 1 watt, we can do some simple math to show that a power input of 1 milliwatt will produce 55 dB of output. Considering a full-range signal, that’s like a quiet background volume level. However, we must remember that reproducing high-frequency information takes significantly less energy. Your tweeters might see much less than 1 milliwatt at a low volume level. Yes, background noise will help mask the distortion, but the clarity and detail will still be lost.
More Ways to Cheat in Creating Specifications
The above information is critical in measuring distortion relative to output levels. Some companies will exaggerate their numbers by measuring power just below clipping or at their half-power level. The latter is, of course, also just below clipping. If we did that with this amp, the single-value THD+N specification would be around 0.09%, rather than the 1-watt value of ~0.65%. One of those numbers looks barely acceptable, while the other is terrible.
Consistent measurement criteria are crucial to providing consumers with accurate data. There are many ways to manipulate numbers to make them look better on charts and graphs.
Weeding Out the Junk
Imagine listening to these amplifiers. The Class D would sound good at all frequencies and not muddy the audio information at low volume levels. The Class AB, on the other hand, would sound terrible at high frequencies. With that said, it’s not great at low frequencies either. Unless you listen to super-compressed music, the AB will add a lot of noise and distortion to your music at anything but the highest output levels. The differences aren’t subtle, either. These amplifiers would sound very different, and looking at the data, as presented above, is an excellent way to pick the winner when comparing the two.
When it’s time to biu a new amplifier for your car audio system, drop by a local specialty mobile electronics retailer and ask to audition the solutions they offer. Listen for changes in tonal balance and the perception of “tightness” at different volume levels. The music should sound clear and detailed when quiet and at concert-level volumes.
More From Our “Amplifier Differences” Series
- Part 1: Frequency Response explores how amplifiers handle different frequencies and how this affects the sound. It discusses the ideal of uniform amplification across all frequencies and examines how real-world amplifiers compare, using specific models for illustration.
- Part 2: Noise delves into the noise that amplifiers can add to the audio signal, how it’s measured, and its impact on sound quality. It explains the signal-to-noise ratio and how different amplifiers manage noise, including the effect of amplifier size on noise performance.
- Part 3: Harmonic Distortion discusses the concept of harmonic distortion, how it affects sound quality, and the performance of different amplifiers in minimizing it. It also touches on the distinction between even- and odd-order harmonics.
- Part 4: Distortion Versus Power Level and Frequency examines how distortion levels in amplifiers change with power levels and frequencies, highlighting the differences between high-quality and low-quality amplifiers in handling distortion.
- Part 5: Intermodulation Distortion focuses on intermodulation distortion, how it’s measured, and its effect on sound quality. It contrasts the performance of different amplifiers in managing IMD.
- Part 6: Car Audio Amplifier Crosstalk addresses how crosstalk between channels in an amplifier can affect the stereo imaging and soundstage of car audio systems, impacting the overall listening experience.
