While browsing car audio groups on Facebook or Reddit, I see the comment that “distortion damages speakers” at least once, if not 10 times, a day. There can’t be many statements that equal this one to demonstrate an incomplete understanding of how speakers, amplifiers and distortion work.
If you’ve been told this by professionals, don’t fret. Most of them don’t understand the concept either. You need to be pretty geeky to fully understand what’s happing when an amplifier is pushed to the point that it clips. You also need to be equally versed in how speakers are rated in terms of power handling. This article will build on my recent article about distortion in audio components to explain one of the most common ways speakers are damaged. Reading and understanding that information is a prerequisite for what I’ll discuss here.
Step 1: Understanding Speaker Power Handling Specifications
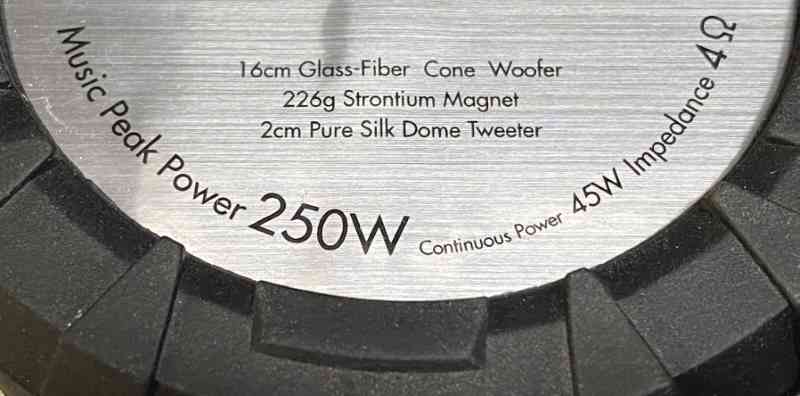
We need to review how speakers are rated before we get to what happens when an amplifier is pushed to clipping. For most, we see a number that describes the power rating(s) printed on a box or the label on the magnet of a speaker. It’s not unreasonable to assume that at least one of these wattage ratings would correlate to something we’d measure from an amplifier. The good news, if you’re looking at a subwoofer, is that the power handling specs and the amplifier power production capabilities are directly related. On the other hand, if you’re looking at a small midrange speaker or a tweeter, the power ratings are based on something far more complex. Don’t fret; I’ll explain.
Let’s use the example of a tweeter, since they’re designed only to play the highest few octaves of the audible frequency range. Tweeters don’t have the excursion elements that are necessary to reproduce bass and midrange information at levels suitable for car audio applications. Likewise, their voice coil assembly isn’t large enough to dissipate significant amounts of thermal energy. When a speaker manufacturer rates a tweeter as capable of handling, say, 50 watts of power, there needs to be a crossover frequency associated with that value. For this article, let’s pick 3 kHz as our crossover frequency.
Here’s how reputable speaker manufacturers test a tweeter with a 50-watt power rating. First, they calibrate an amplifier using a test tone recorded at 0 dB FS to produce 50 watts into the rated load of the speaker. In the case of the tweeter we’re discussing, it must not be connected to the amplifier during this process. Next, a high-pass filter is added to the system so that only information above 3 kHz (in this example) is passed to the tweeter. Finally, the manufacturer plays a particular noise track that has peaks at -1.01 dB FS. The noise has been processed so that the dynamic range is about 3 to 3.5 dB, equating roughly half of the peak power. The filtered pink noise track is played for many hours (usually eight, but sometimes 100). Passing this test confirms both continuous power and peak power handling requirements at once.
What does “passing the test” mean? That depends on the speaker manufacturer. For some brands, a pass means the speaker continues to function in any capacity. For others, the electromechanical parameters of the speaker (voice coil resistance and inductance, driver Q and suspension compliance, for example) may not change by more than 10%. As an aside, most speakers are typically tested on a baffle board and not in an enclosure of any kind. We’ll get to why this matters later in this article.
Here is the issue: At no point in time is 50 watts of power sent to the speaker. Remember that modified pink noise was used for the test. Pink noise only reaches the maximum output at and below 20 Hz. Above 20 hertz, the average output attenuates at a rate of 10 dB per decade. So, from 20 Hz to 200 Hz, the output drops by 10 dB. From 200 Hz to 2 kHz, the output drops another 10 dB. A reduction in 20 dB correlates to 1% of the power that would be sent to the speaker at 20 Hz – which would be about 0.5 watt in our example. Using the CTA-2034 test track, the average peak level that would be sent to our subject tweeter is at a level of about -55 dB FS, and 20 Hz is around -33 dB FS. That’s a difference of 22 dB or 0.00631 times the power at 20 Hz. In this example, that works out to 0.315 watt of power, on average, to the tweeter.
Let me restate, so there is no confusion: This tweeter rated to handle 50 watts of power is only driven with 0.315 watt RMS during power handling testing. Peak power might be twice that at about a whopping 0.63 watt.
This method of rating power handling is a holdover from the methods used to rate full-range home audio speakers. Nevertheless, it’s the current method used by most speaker manufacturers. It complies with the ANSI/CTA-2031 Standard for the Testing and Measurement of Mobile Loudspeaker systems, the ANSI/CTA-426-B Loudspeaker Optimal Amplifier Power standard and the IEC-60268-5, 2003 Sound System Equipment Part 5: Loudspeakers Standard. Personally, tell me the tweeter can only handle 1 watt of power above 3000 Hz. If I mess up and send it more and it fails, I’ll know that’s my fault.
These same procedures are used to rate midrange speakers. For example, a 2.5-inch driver might have a rating of 100 watts, yet using the CTA-2034 noise track as the stimulus with a high-pass filter at 250 Hz, it may never get more than 12.5 watts and a peak level of 25 watts.
Woofer Power Handling
I mentioned earlier that the standard for testing loudspeakers typically has the driver mounted on a baffle board. This board generally is in a relatively large room. This testing method is advantageous to the speaker’s longevity as heat generated by the voice coil can escape into the room.
A much more difficult test for power handling is to mount a driver, typically a subwoofer, in a sealed enclosure, then feed it the modified pink noise stimulus for the test duration. The heat from the voice coil dramatically increases the temperature inside the small air space, reducing the cooling effect. I have industry colleagues who perform this sort of testing for manufacturers. They often report that stickers fall off the back of magnets, and sometimes wiring laid across the speaker chassis can start to melt. Occasionally, browning is visible on the inside of the wooden enclosure from the heat generated during the test. Passing this test while maintaining the 10% parameter tolerance is difficult. When I was the product development manager for a car audio company, I used this test for the subwoofers I brought to market. Those drivers were tested for 10 to 11 hours.
An Important Thought on Speaker Efficiency and Thermal Capacity
Something else you need to know about speakers is that they are notoriously inefficient. A speaker with an 89 dB SPL efficiency rating wastes over 99.5% of the energy from the amplifier as heat. If that has you thinking that speakers are better at being heaters than they are at converting electrical signals into audio, then you understand perfectly.
The varnish on a voice coil winding in a speaker is typically good for temperatures up to 482 degrees Fahrenheit (250 Celsius). If you send too much power to a speaker, this varnish starts to boil and will no longer hold the coil in place. The winding can short against itself, or it can start to unravel and run into the top plate and be ripped from the former.
Step 2: Understanding What Happens When an Amplifier Clips
Clipping is a term used to describe what happens when the signal going into the amplifier multiplied by the gain of the amplifier would produce an output waveform that exceeds the maximum voltage or current delivery capabilities of the amplifier. Yes, current requirements to the load (speaker(s)) may be a limiting factor in how much power an amplifier can produce. Most compact car audio amplifiers are limited by how much current they can supply into low-impedance loads.
Let’s look at the output voltage of an amplifier and a few theoretical measurements inside the amp to understand what’s happening when a signal is clipped.
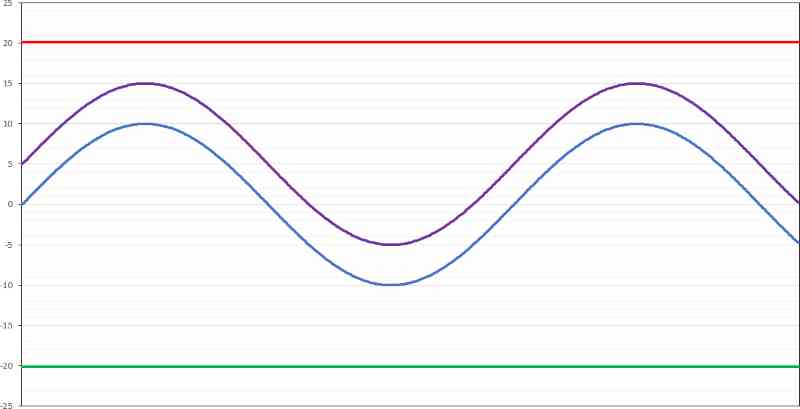
To keep this simple, we’ll look at a voltage-limited amp, as that is the most common condition for midrange and high-frequency speakers. Let’s say the amplifier designer wants it to produce 50 watts of power per channel into a 4-ohm load. The maximum voltage the output signal needs to accomplish this with a 4-ohm load is 14.14 volts RMS. The peak-to-peak voltage of the waveform would be 40 volts. The power supply in the amplifier needs to be designed to provide +20 and -20 volts to recreate this waveform accurately. The actual voltages on the power supply outputs need to be a little higher, but that’s the amplifier designer’s issue, not ours.
If we feed an audio signal with an amplitude of 1.414 volts into an amplifier with 20 dB of gain, the output will be 14.14 volts. Voltage gains are calculated differently than power gains. You can read my article on decibels (https://www.bestcaraudio.com/lets-talk-about-uses-for-decibels/) for an explanation. At this level, the output waveform should match the input waveform, and our music will be good and loud.
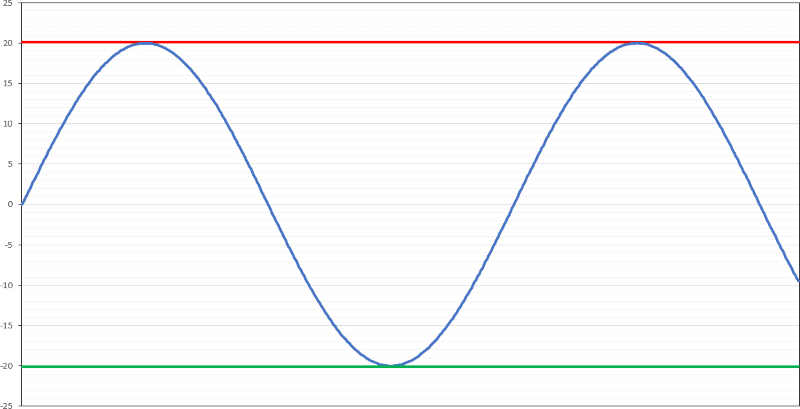
The computer-generated image above shows the positive rail voltage of 20 volts in red, the negative rail voltage of -20 volts in green and our clean output waveform in blue.
What happens when someone turns the sensitivity (gain) control on the amp up so that there’s 21 dB of gain? Now, the amplifier circuitry attempts to reproduce a waveform with an RMS voltage of 15.86 volts and a peak-to-peak voltage of 44.86. However, as the power supply limits the maximum output voltage, the waveform won’t increase beyond 40 volts peak-to-peak, and the tops of the signal will be flattened or clipped.
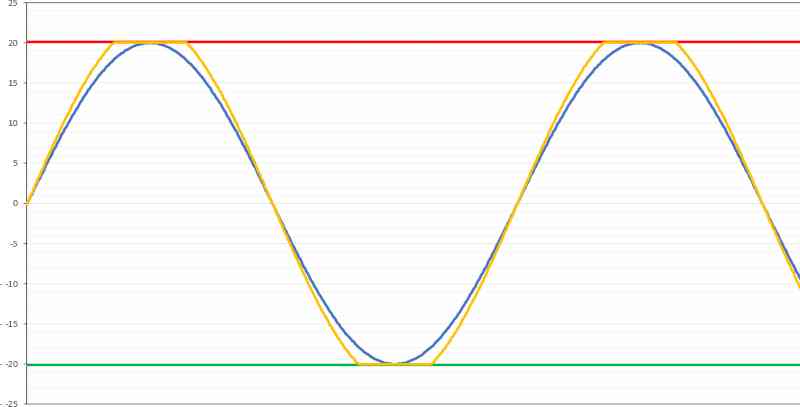
If you look at the yellow trace in the graph above, the clipped tops and bottoms represent the maximum voltage limit of the amplifier. It doesn’t take a rocket scientist to know that the output waveform no longer matches the shape of the input waveform. Thus, significant distortion will be added to the audio signal.
Clipping and Distortion Content
Here’s a crucial statement that you need to engrave in your memory: There is no DC component in a clipped signal. This statement is counterintuitive as there are horizontal parts in the signal. While logical, this is still an AC waveform. If there were a DC component in an AC signal, it would look like the image below.
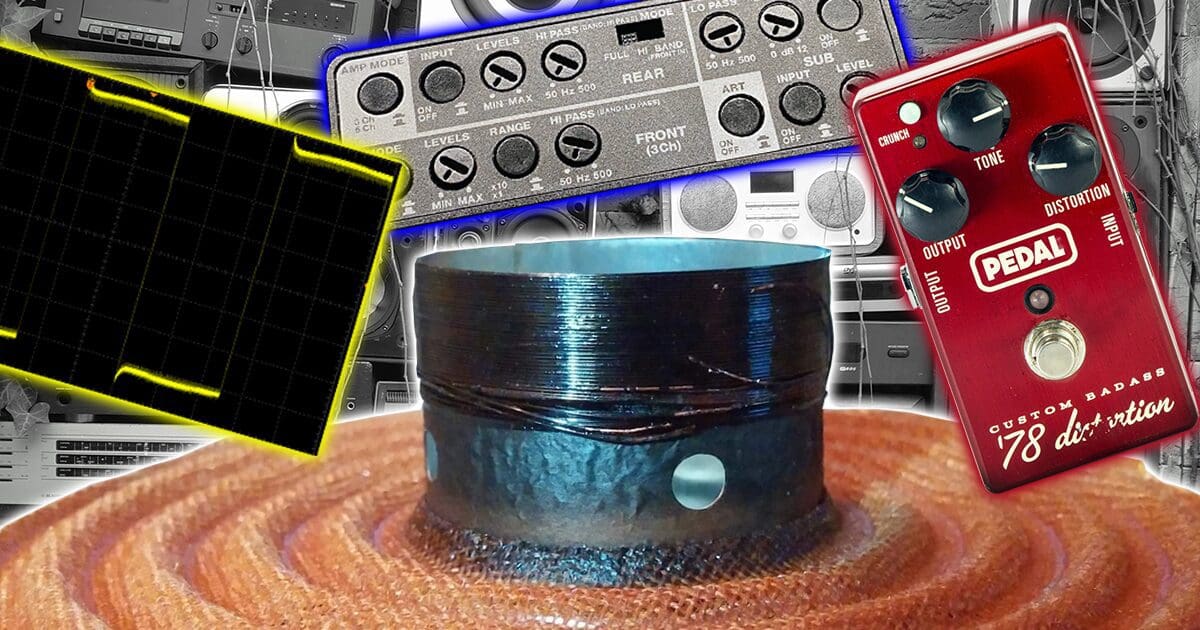
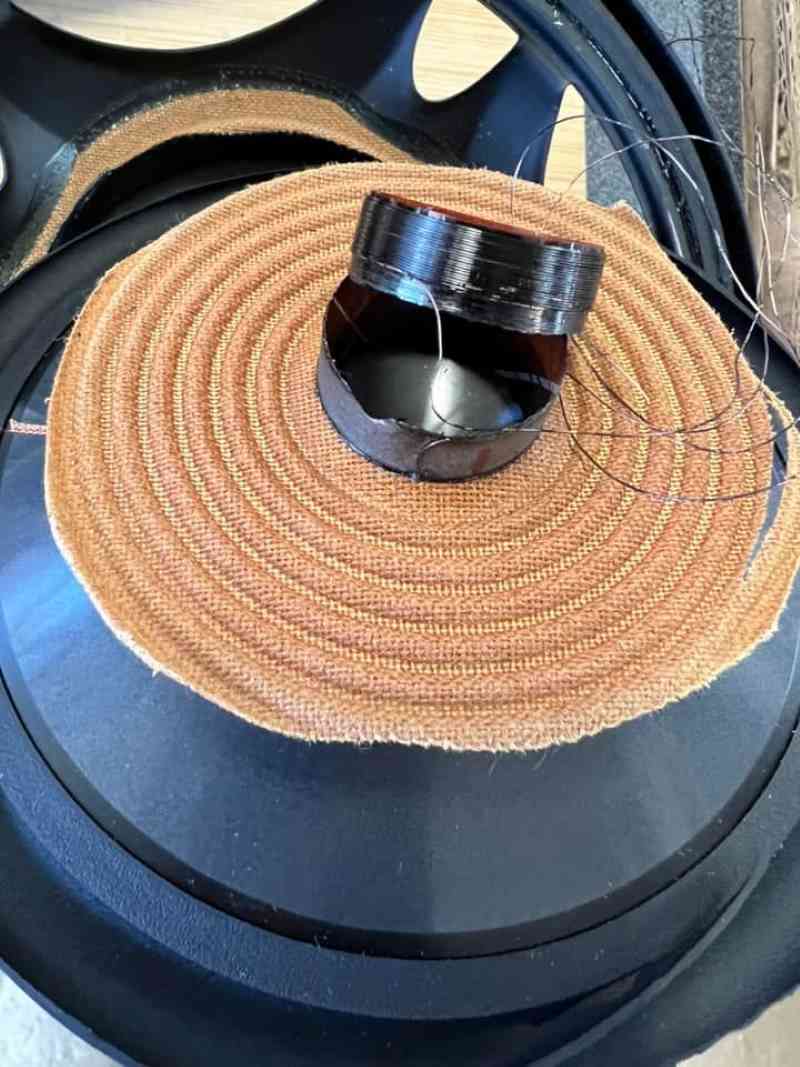
We call the purple waveform above “an AC signal with a DC offset.” In this example, the zero-crossing point is at 5 volts. This isn’t how clipping works. If your amplifier does this on one output terminal with the other referenced to the ground, your speakers won’t be very happy, will sound terrible and likely won’t last very long. The burnt voice coil in the background of the lead-in image (provided to me by Richard Hall) resulted from an amplifier putting out DC voltage to the speaker.
If the horizontal part of the waveform at the top and bottom where the signal is clipped isn’t DC, what is it? It’s a group of harmonics in a particular pattern.
Let’s Talk About Audio Waveforms
Musical audio signals are made up of thousands of frequencies. Technically, they contain a nearly infinite number of frequencies. We can have 50 Hz along with 50.1, 50.01, 50.0001 and more – all are different frequencies. You get the drift. The amplitude and phase relationships of all the frequencies you hear combine to determine a certain sound pressure level at your eardrums when listening to music. A microphone captures that pressure level and converts it into a voltage which is then converted to a digital level for storage.
This capture, conversion and storage process repeats a minimum of 44,100 times a second (for a compact disc) or as much as 192,000 times per second for high-resolution recordings. Through a process called Fourier analysis, a computer can decode the frequency content in an audio signal and display amplitudes in the frequency domain. Sounds scary, right? Yes, if you want to do the math yourself. No, if you’re going to let existing software or hardware analyze the signal for you. Have you ever seen an RTA or frequency plot of an audio signal? What you’re looking at is Fourier analysis. Less scary, right?
The image below is that analog waveform of me speaking the letter E.
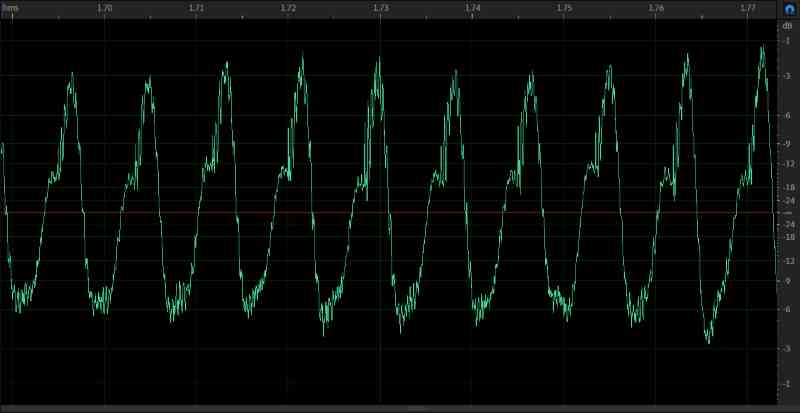
It’s easy to see that the sound you’d hear is made of many different frequencies. We can analyze the frequency content to show what frequency information the waveform contains and the amplitude of the different frequencies.
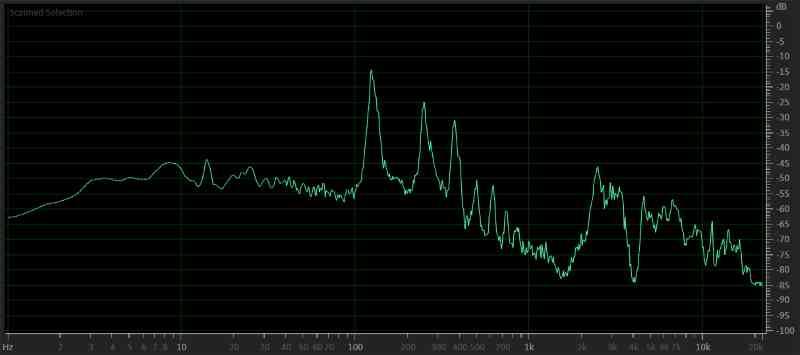
The spectral content graph shows a fundamental frequency at 121 Hz with strong (loud) harmonics at 242 and 364 Hz. There is also essential information at 2.45 kHz with several harmonics above that. Without that higher frequency information, it sounds like I am saying a muffled version of the letter O instead of an E.
Specific combinations of frequencies can be used to draw waveform shapes. We’re all used to seeing a pure sine wave, but we can also create triangle, sawtooth and square waves. The latter, the square wave, is what we need to focus on to understand the clipped portion of our audio signal.
Here’s what a square wave looks like as an analog waveform generated by Adobe Audition.
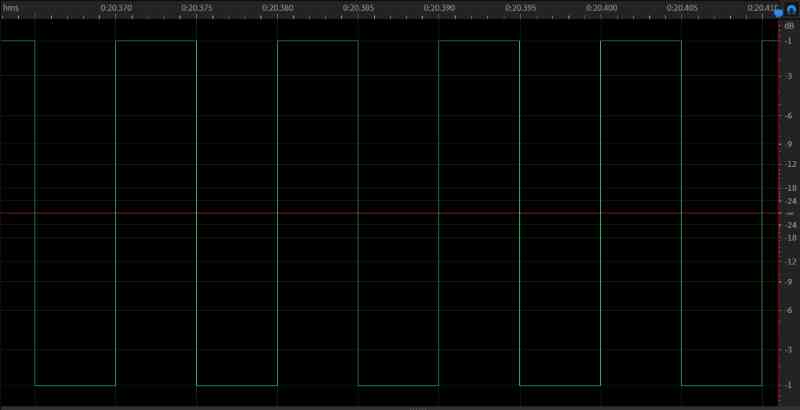
Now, here is the frequency content of a square wave.
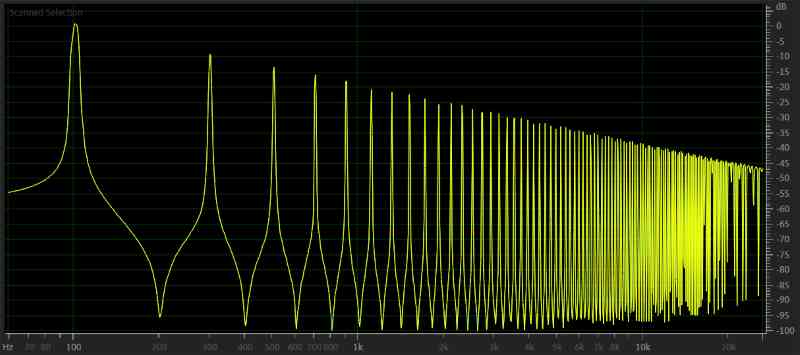
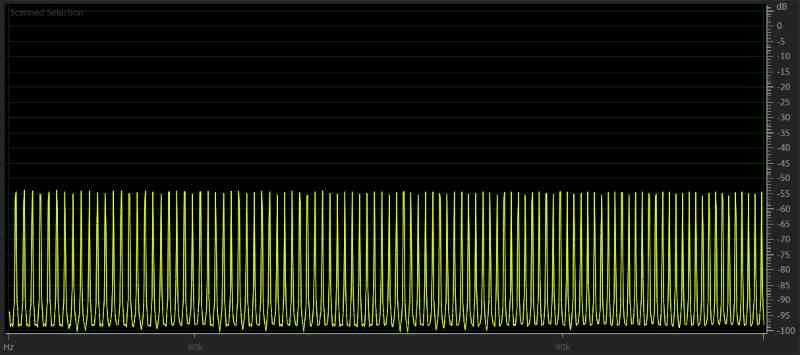
The first thing to notice is that the waveform is made up of odd-ordered harmonics of the fundamental frequency. The base frequency for our square wave is 100 Hz. The spectral analysis shows 300, 500, 700, 900 and many more harmonics added. Those harmonics don’t end. I created this waveform in Adobe Audition at a sampling frequency of 192 kHz. There are harmonics spaced 300 hertz apart, right up to 96 kHz. The image below shows relatively loud content right at 96 kHz
Here are a few critical items to remember from this analysis: A heavily clipped 100-hertz signal produces frequency content that extends well beyond the range of human hearing. The harmonic content can exceed the high-frequency operating limit of the amplifier.
Correlating Distortion to Frequency
We now have the tools to understand what happens when the signal from an amplifier is clipping. Let’s apply them to our analysis of amplifier output. The horizontal portion of the waveform is full of harmonic content. These odd-order harmonics “draw” the flat parts of the audio waveform. It’s not DC. Please stop saying that. I used to believe it was. It isn’t. Please repeat after me: “There is no DC in a clipped waveform.”
Now, let’s look at what happens when connecting an amplifier to a speaker. For this example, we’ll use a typical 6.5-inch coaxial speaker, since that’s what people like to blow up the most – aside from subwoofers. Next, we’ll use a low-power amplifier and examine what happens in terms of frequency content and around where the amp reaches clipping.
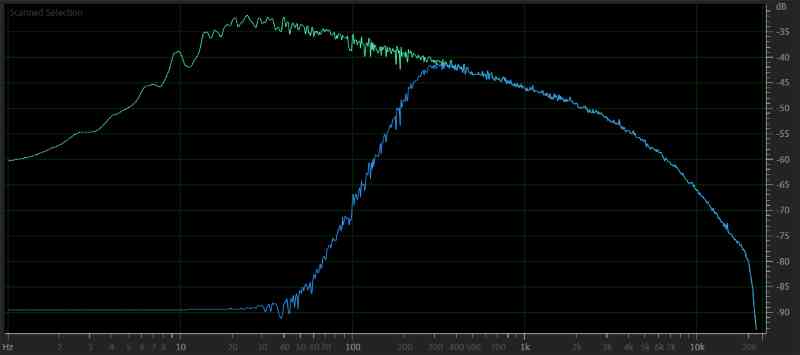
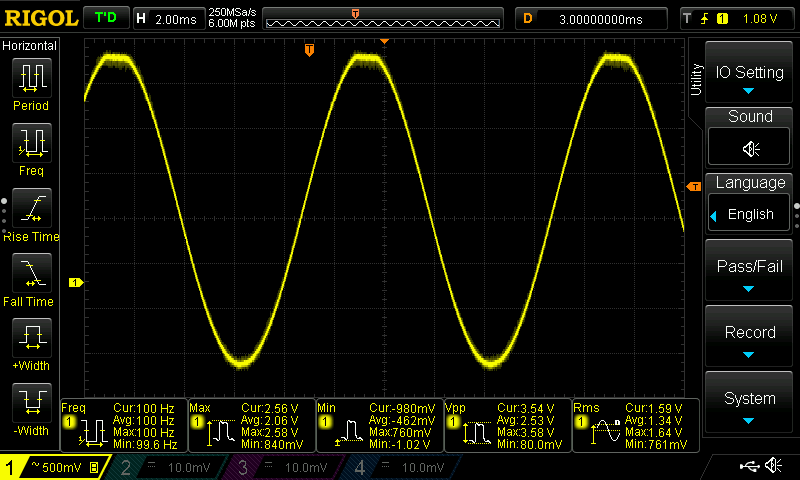
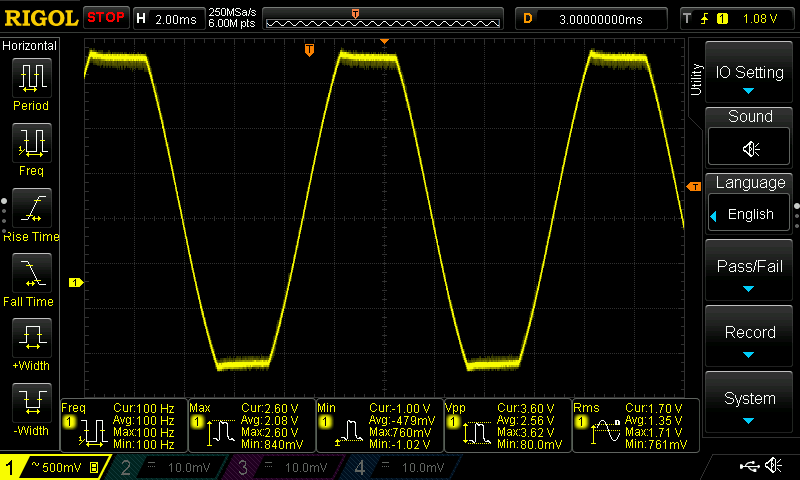
Here’s a real amplifier playing a 100-hertz sine wave at 1 dBV below the point that the output signal clips.
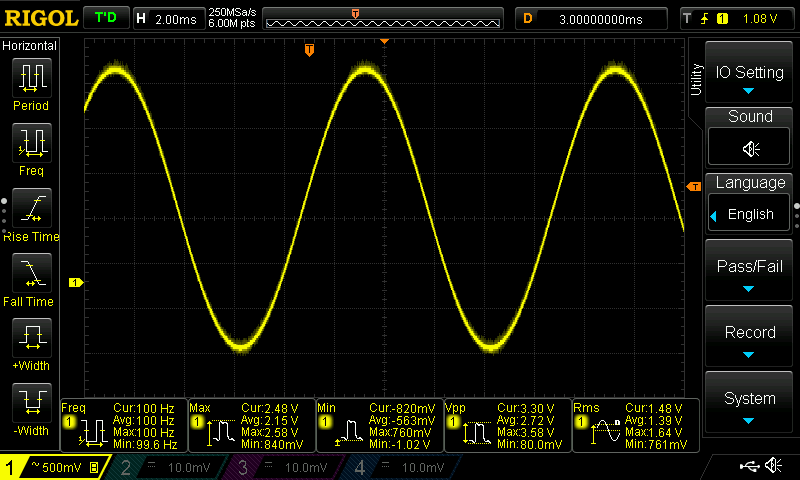
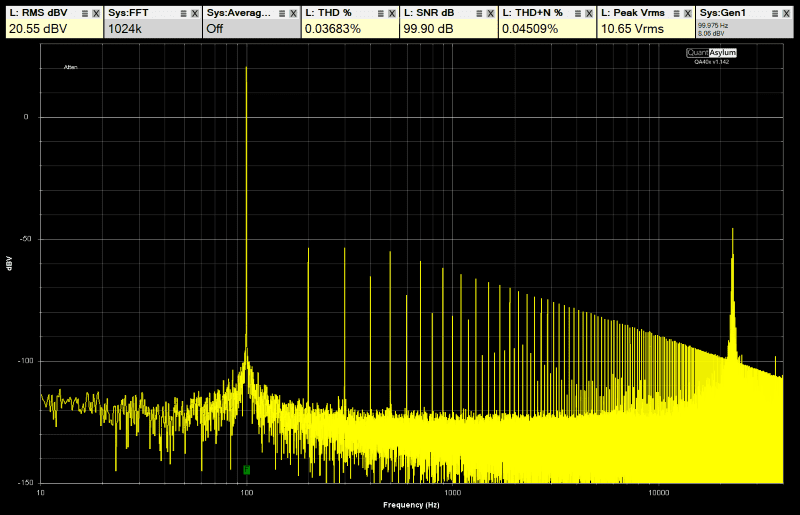
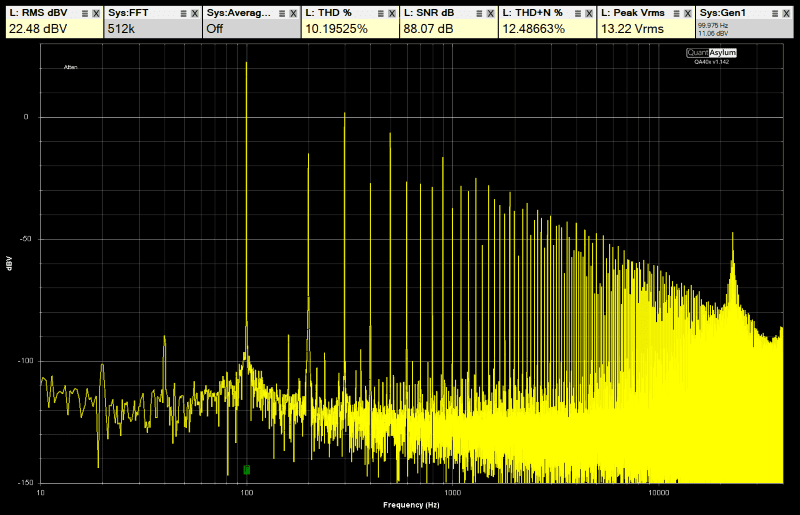
This old amp is holding its own, producing 0.0368% total harmonic distortion at just below clipping. Note that the harmonic content above 3 kilohertz is at a level of about -75 dB V. Now, let’s turn the amp up until the waveform is at 1% total harmonic distortion.
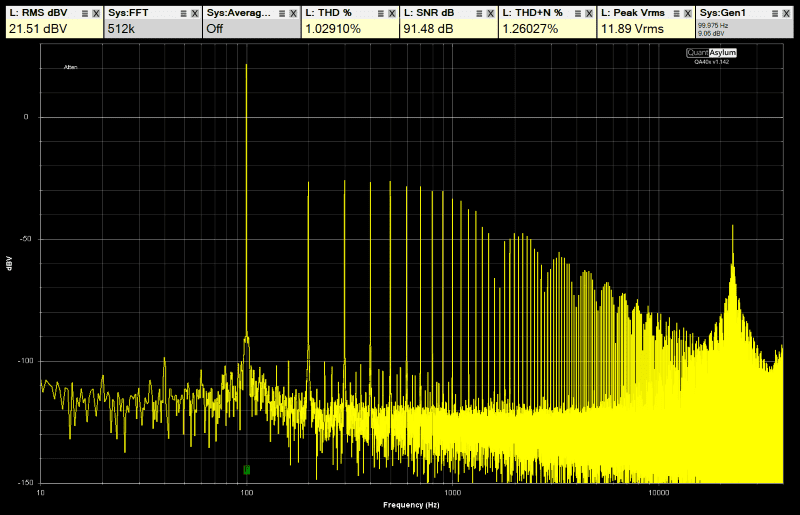
Look at how much extra high-frequency energy is added to the signal going to the speaker. The second and third harmonics went from being about -54 dBV to having the second through seventh harmonics being louder than -30 dBV. The harmonic content above 3 kilohertz is now at a level of -55 dB. That’s 100 times more voltage at one frequency than just 1 dB less gain.
Let’s increase the signal to the amplifier by one more decibel volt and see what happens.
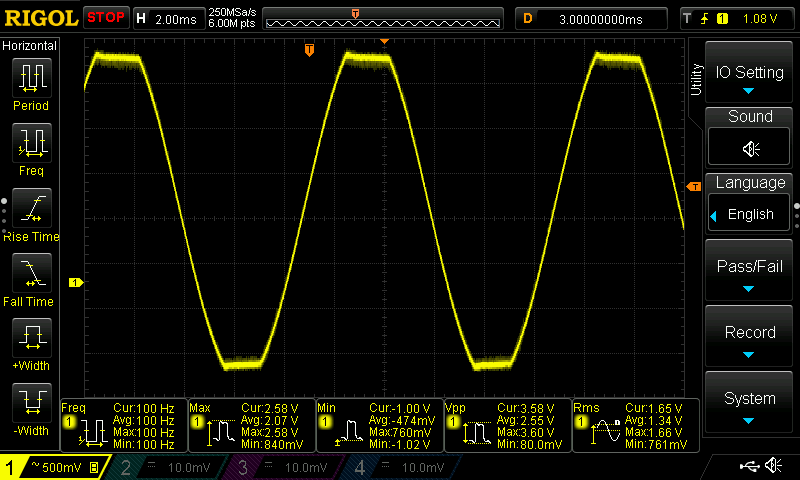
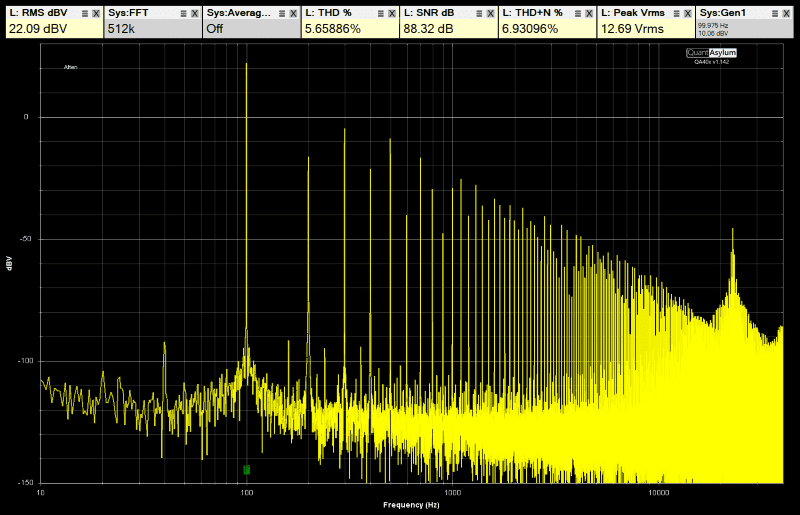
We now have a third harmonic at -0.5 dBV, which equates to about 0.94 volt, and the harmonics above 3 kilohertz are peaking at -45 dBV. That’s another 10 times more voltage than when the amp was at 1% THD. Again, I’ll remind you: This is all from clipping a 100-hertz sine wave.
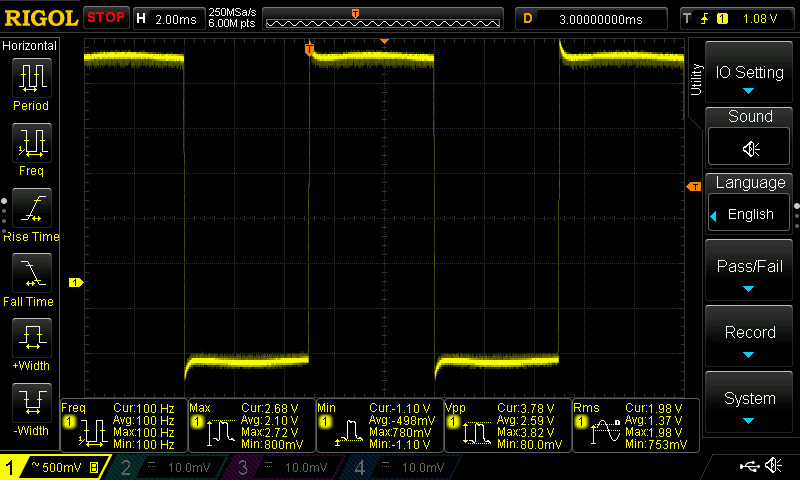
Two more examples ought to help hammer home the message. Plus, it’s neat to see what happens when we set the sensitivity controls on an amplifier incorrectly. Here’s yet one more decibel volt of signal going into our little amplifier.
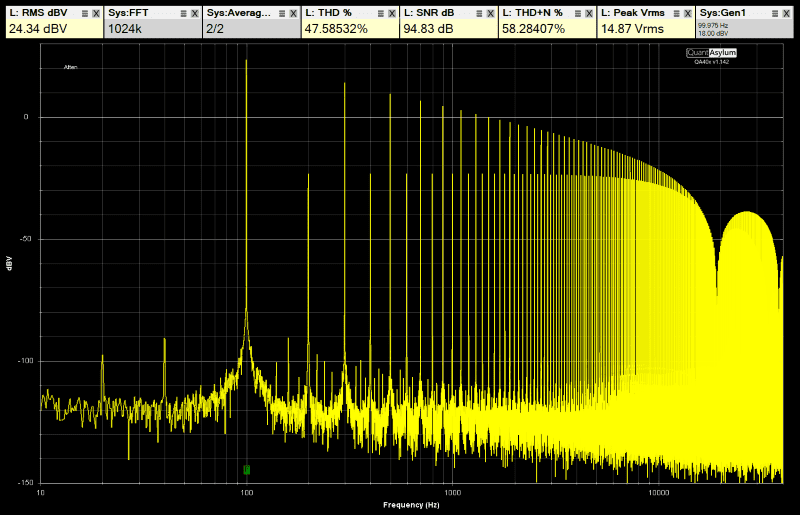
Now we have a good solid mess on our hands. The waveform on the oscilloscope looks messy. Even the lowest-quality, lowest-resolution handheld or smartphone-based oscilloscopes would show this clipping clearly.
In terms of spectral content, we have a 300-hertz spike at about +2 dBV, which is around 1.25 volts (which equates to 0.4 watt into a 4-ohm load). Along with all the other harmonics that are sending additional power to the speaker, we have harmonics above 3 kilohertz at levels of -40 dB V. Again, we have a LOT of high-frequency content from a 100-hertz square wave.
Engage safety squint and put your mother on speed dial! I’ve cranked the sensitivity control on the amp up all the way to show you just how bad things can get.
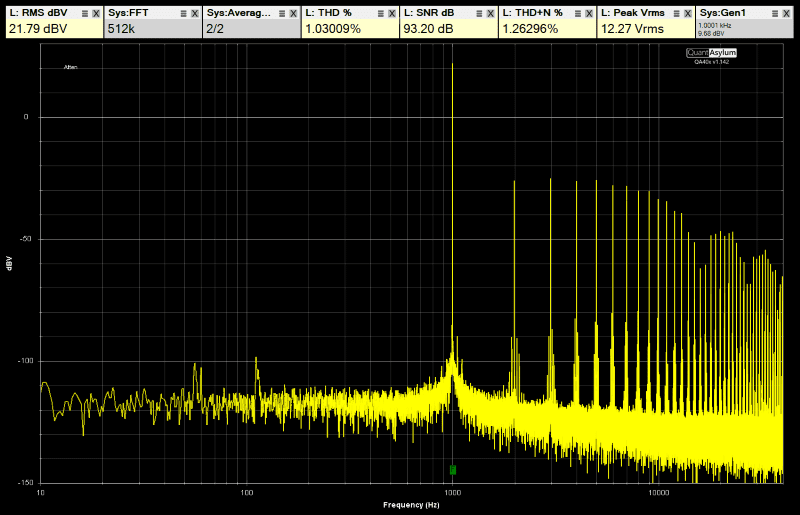
Look at those beautiful harmonics! We’ve got content at 300 hertz at an amplitude of just a hair over 5 volts, which is 6 watts. There’s more content at 500 hertz at an amplitude of just over 3 volts, equating to 2.4 watts of energy. This repeats itself every other harmonic. In terms of what our tweeter would see, the signal is at about -0.6 dB V at 3 kilohertz, which works out to the right at a half-volt and a real 62 milliwatts of power.
Let’s step back and think about how the tweeter was rated. A 50-watt tweeter can really only handle 315 milliwatts. Thankfully, this is a low-power amplifier and produces only 35 watts of power at 100 Hz at 1% distortion. That’s less than some genuinely high-power radios. Is our tweeter safe? We also have high-level audio signals at 100-hertz steps above 3.1 kHz to well beyond 20 kHz. The spike at 3.1 kHz has an energy level of about 62 milliwatts. The spike at 3.3 kHz has about 49 milliwatts watts of energy. The spike at 3.5 kHz adds another 35 milliwatts. The energy at 3.7 kHz adds 28 milliwatts. We haven’t even crested 4 kilohertz, and we have 175 milliwatts. We are using half the thermal capacity of our tweeter, and we are playing (heavily distorted) bass frequencies.
What if the clipping happened at a higher frequency? What would the harmonic content look like if we clipped a 1000-hertz signal?
Look at how much more energy is going to the tweeter compared to clipping a 100-hertz tone. Luckily, this is a little less likely to happen as the amplitude of the information in music is typically much lower at 1000 hertz than 100 hertz.
Did Our Tweeter Survive?
Do you think the tweeter would survive playing with this much information going to it? I’d say it would be borderline. If the amp was set such that it didn’t clip with a 0 dB FS signal, there’s almost no chance of damaging the tweeter when playing music.
Imagine if we had a 75-watts-per-channel amp. The clipping would happen at much higher amplitudes, and it wouldn’t take long to overheat that tweeter. This raises the question: Is it distortion that damages the tweeter or power?
The answer is simple. I can record this clipped signal from the amp and play it back for hours at reasonable volume levels into a tweeter or a coaxial speaker. The speaker won’t be damaged.
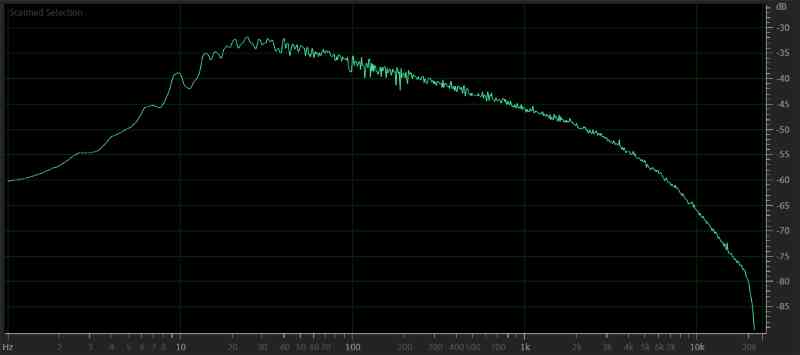
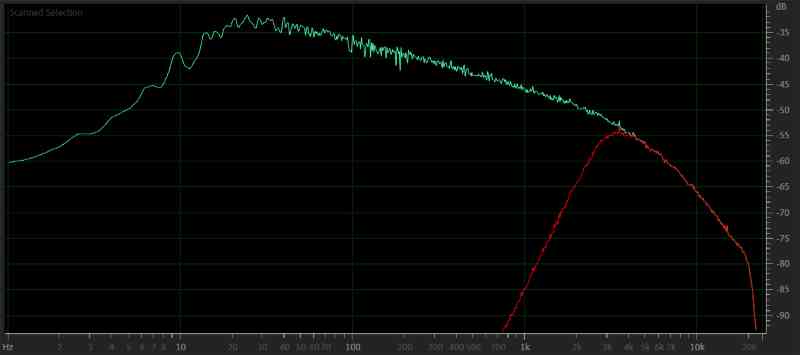
Have you ever looked at the spectral content of a distortion pedal from a guitar? Oh yeah, sorry – most people aren’t that geeky. The spectral content isn’t much different than what a clipped signal contains. For example, here’s a graph of the spectral content of a classical guitar chord in red. The red trace happens to the frequency content when it’s passed through a pair of virtual distortion pedals added in Adobe Audition.
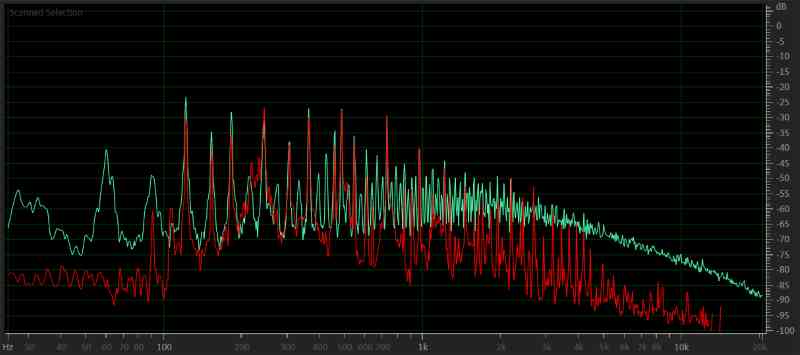
There’s an increase of more than 20 dB of high-frequency energy with the distortion pedal processing added to the signal. That’s equivalent to 100 times as much energy. Yet, you can listen to screaming electric guitars for days, weeks or months on your home or car stereo or a set of headphones without damaging them.
What Causes Speakers To Fail?
Let’s wrap this up, shall we? Speakers fail in one of two ways: They can be physically damaged if the signal results in cone excursion that causes mechanical failure. This extreme excursion might cause a spider to break off from a voice coil former in a woofer or sub. The other (more popular) way is to send too much energy to the speaker, overheat the voice coil winding or tinsel leads and cause them to fail.
If you use a 1000-watt amplifier with a 250-watt subwoofer and play a test tone at the full power rating, the sub won’t last very long.
Sending significant amounts of high-frequency content to a speaker, in particular a tweeter, in and of itself doesn’t damage it. Sending too much energy to a tweeter, on the other hand, will damage it. If you’ve tried to set the gains on your amplifier with a 4 kHz 0 dB FS test tone, that will kill a tweeter quickly. Another way is to clip the output of an amplifier to add high levels of harmonic information that overheat the tweeter voice coil. If the passive crossover network is functioning properly (and doesn’t include any protective components), then too much power will damage the tweeter.
Go forth and spread the good word on how speaker ratings work and what happens when an amplifier distorts. You’ll make the car audio community a better place for it! Distortion doesn’t damage speakers; too much power does.
