Our Car Audio Masterclass series offers a comprehensive introduction to the essential concepts of car audio systems, covering everything from basic terminology to advanced measurement techniques. To learn more, check out the other articles in the series:
- Car Audio Masterclass 101.1 – Audio Basics: Learn key audio terms and concepts.
- Car Audio Masterclass 101.2 – Understanding Basic Electricity: Explore voltage, current, and resistance.
- Car Audio Masterclass 101.3 – Electric Circuits: Understand series and parallel circuits.
- Car Audio Masterclass 101.4 – Magnetism: Discover the role of magnetism in speakers.
- Car Audio Masterclass 101.5 – Direct and Alternating Current: Compare DC and AC currents.
- Car Audio Masterclass 101.7 – The Decibel: Learn about decibel measurements.
- Car Audio Masterclass 101.8 – Speakers, Power, and SPL: Understand speaker power and sound levels.
- Car Audio Masterclass 101.9 – Time and Frequency Domain Measurement: Explore frequency and time measurements.
- Car Audio Masterclass 101.10 – Digital Multimeter: Learn to use a multimeter in car audio.
In our last lesson, we introduced the topic of alternating current (AC). All audio signals—from a radio to an amplifier or from an amplifier to a speaker—are AC. This is what makes the speaker cones move forward and rearward. We’ll explain how a speaker works shortly. In the meantime, we need to look at a bit of special math related to making voltage and power calculations concerning these non-direct-current waveforms. Let’s look at AC calculations.
Visualizing AC Signals
The image below is an example of an audio waveform.
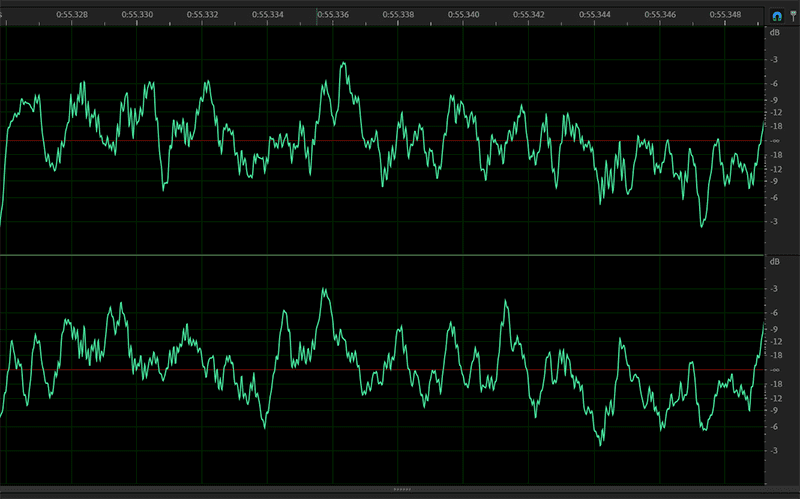
The waveforms obviously appears random and unpredictable in shape. The portion under the infinity crossover point is completely different from what’s above it. Further, the information on the left and right channels is different. All this complexity makes it nearly impossible to calculate the specific amount of power that an audio system is producing at any given time.
To keep this lesson simple, we are going to look at a sine wave. A sine wave is a specific AC signal waveform with a single frequency, which allows us to make simple calculations regarding voltage, current, and power. Other waveforms include square waves, sawtooth waves, and triangle waves. These latter waveforms have different harmonic content. We will, of course, look at those in another lesson.
Measuring AC Wavefoms
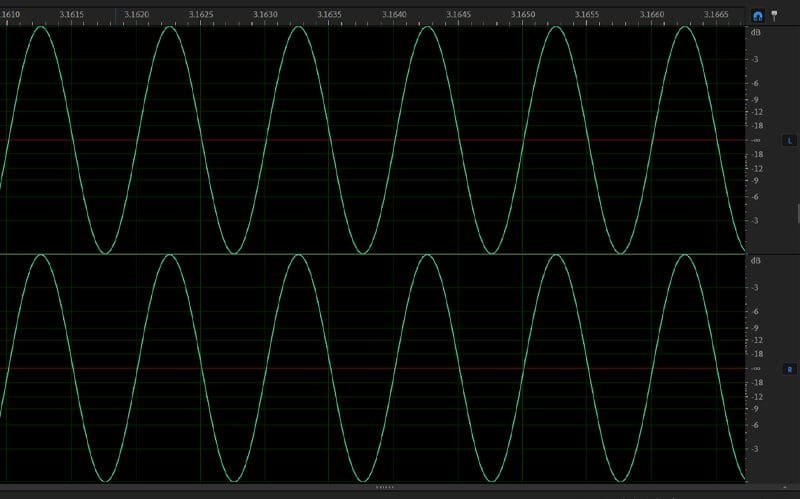
The image below is of a 1 kHz sine wave at an amplitude (recording level) of 0 dB. The latter refers to how much below the theoretical maximum of the storage medium the waveform uses. Zero dB means it’s recorded as loud as possible. We’ll talk about amplitudes in another lesson.
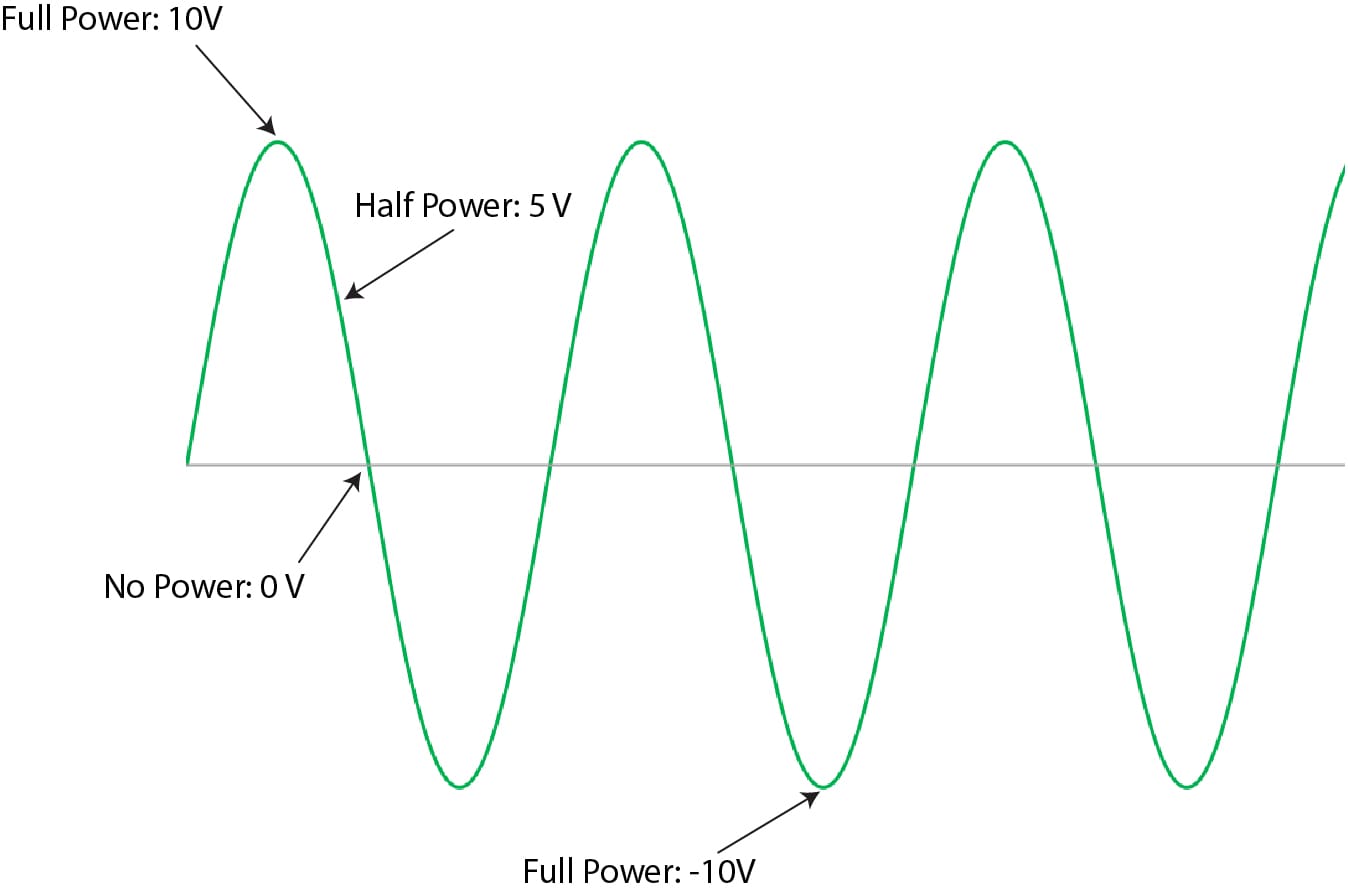
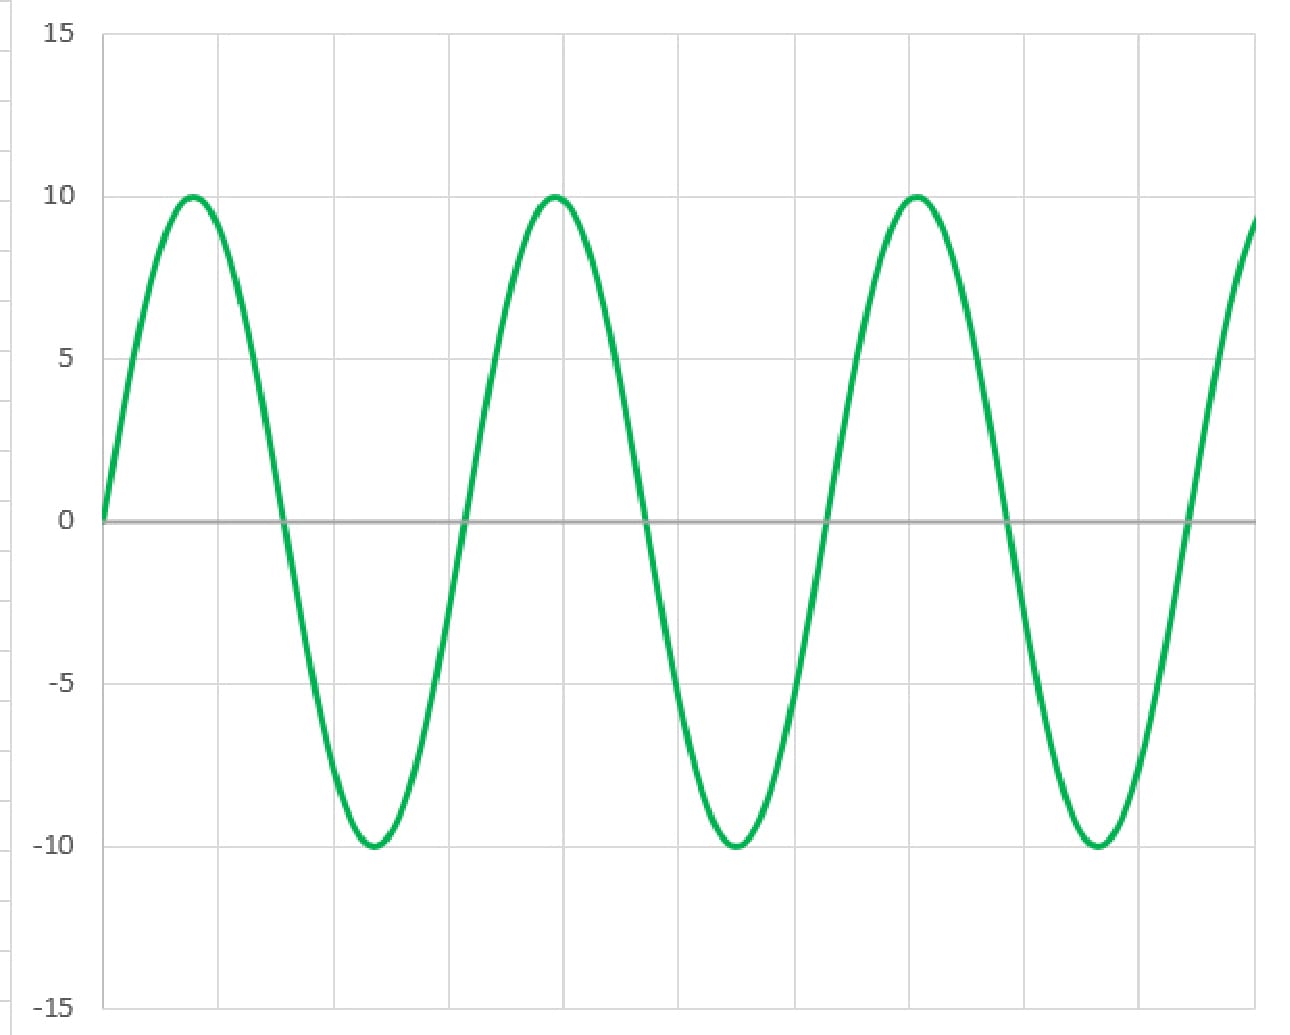
If we were to play the above track on a radio connected to an amplifier, we’d see the image below if we used an oscilloscope. This would be the AC waveform going to the speakers.
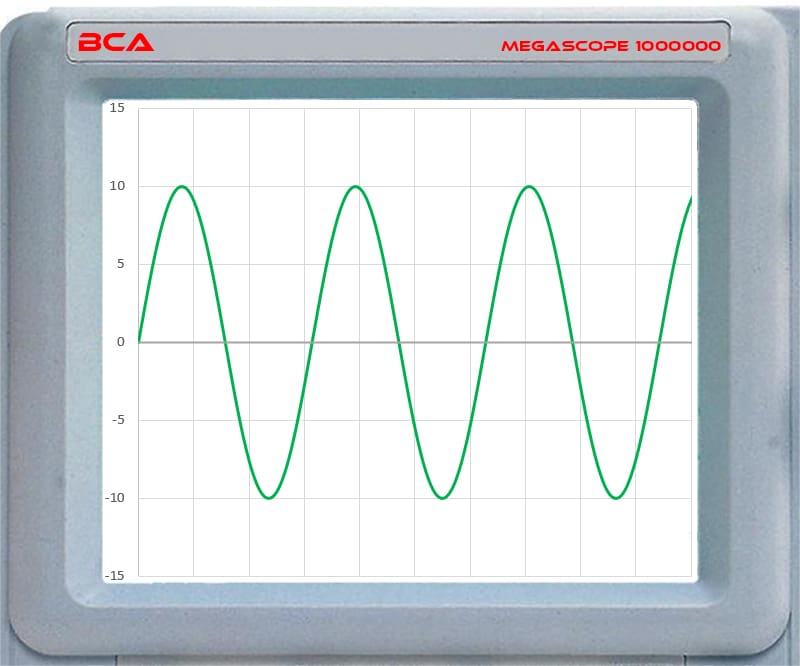
There are a few pieces of information we can extract from the image above. First, the peak-to-peak (V P-P) voltage is 20 volts. The highest value is +10 volts, and the lowest is -10 volts. The peak voltage (V peak) would be 10 volts. In this example, both the positive half of the waveform and the negative half have the same amplitude of 10 volts on either side of zero. We’ll talk more about measuring voltages in our lesson about oscilloscopes.
Before we move on, it’s important to reiterate that we are only looking at a single-frequency sine wave. Analyzing multiple frequencies simultaneously is very complex. We will explore that concept in a CAM201 lesson.
Power Calculations
When we measure a DC voltage, like that of a car battery, our multimeter and oscilloscope show the same value—a constant level. Let’s say that level is 10 volts. If we look at 10 volts on an oscilloscope, it would look like the image below.
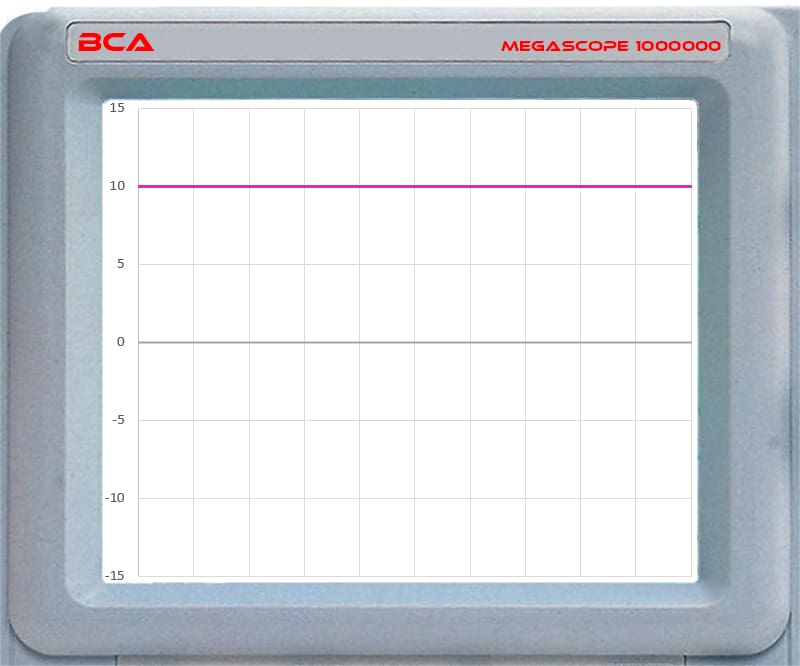
It’s easy to see that the same potential energy is delivered to the load at all points in time. As such, doing the math to calculate power transfer is straightforward. However, if we go back to the AC waveform, the work done varies with the specific measurement point in the waveform. Technically, as the sine wave crosses the 0-volt line, no work is being done. When the waveform is at its highest or lowest levels of +10 V and -10 V, then it’s providing a full potential of 10 volts.
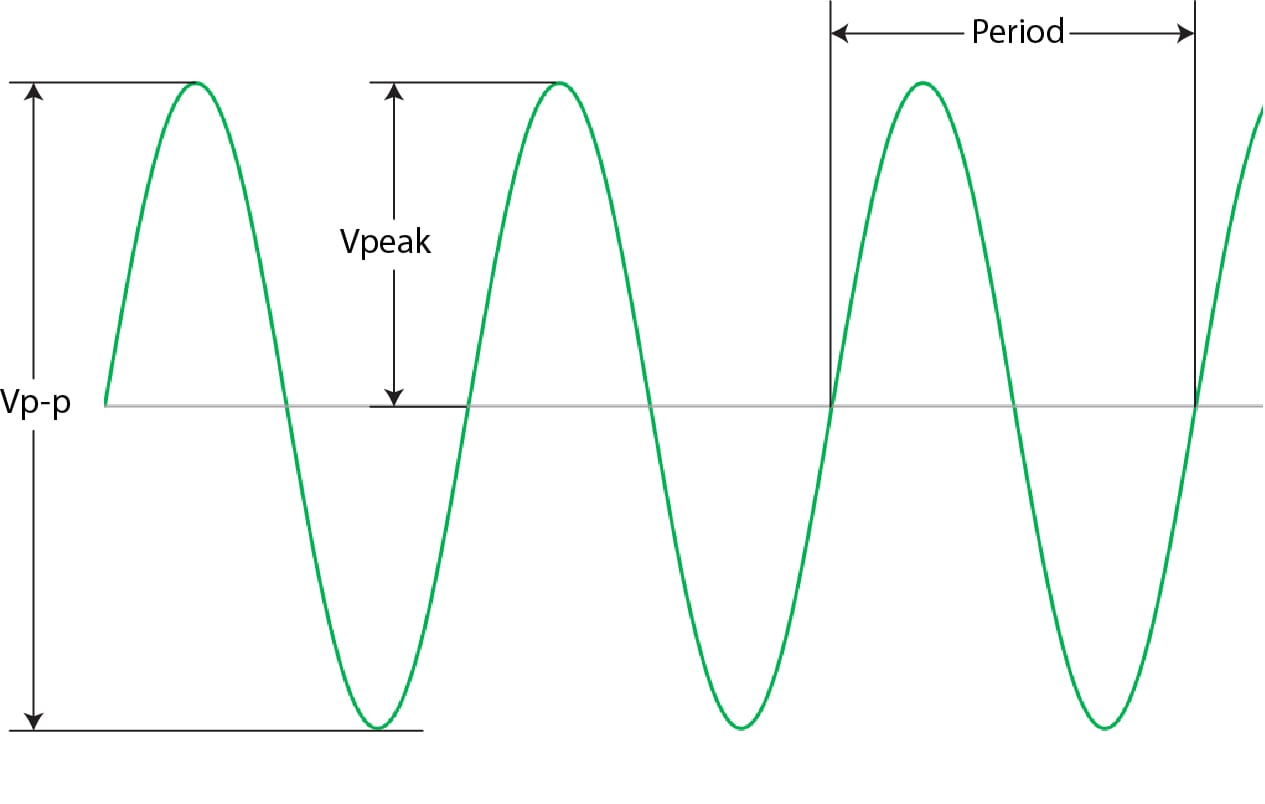
We need to pause for a moment and review some of the different parts of an AC waveform. The amplitude measurement from the highest point to the lowest point is called the peak-to-peak voltage. We use the abbreviation V P-P to represent this value. The voltage from the zero-crossing line to the highest peak is called the peak voltage. We use V peak to represent this level.
While we discuss AC waveform terminology, we will throw in one more important definition—period. The period, measured in seconds, describes the point where a waveform repeats. Interestingly, if you take the inverse of the period (divide the number by the period in seconds), you get the frequency of the waveform.
Root Mean Squared
However, we don’t typically look at specific points in a sine wave to calculate power. As such, we need a way to figure out how much work the waveform does on average. The formula for this power calculation divides the V peak by the square root of 2. The equation below illustrates this better.
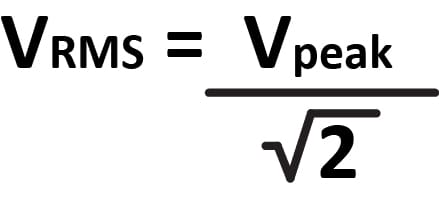 We call this the Root Mean Square voltage, or V RMS for short. You can also calculate the amplitude using the formula V RMS = V peak × 0.707107, which we usually abbreviate to 0.707.
RMS Voltage Definition
So, what does the RMS voltage represent? It’s an AC waveform voltage level that does the same amount of work as a DC voltage of the same amplitude. Let’s use our 20 V P-P waveform to explain this better. For sine waves that are equal in amplitude above and below the zero-crossing line, V peak is half of V P-P. In our example, this means V peak is 10 volts. If we divide that value by the square root of two, we get 7.071068 volts. This means that applying a 20-volt peak-to-peak sine wave signal to a resistor will cause it to heat up by the same amount as if you applied 7.071068 volts DC. In short, both voltages do the same amount of work. This makes them equivalent in power.
Your Wall Outlet is 170 Volts
Whenever we talk about AC voltages, we are usually talking about the RMS level. For example, if you were to connect a suitably isolated oscilloscope probe to the hot wire of a wall outlet in your home or office, you’d see the waveform below:
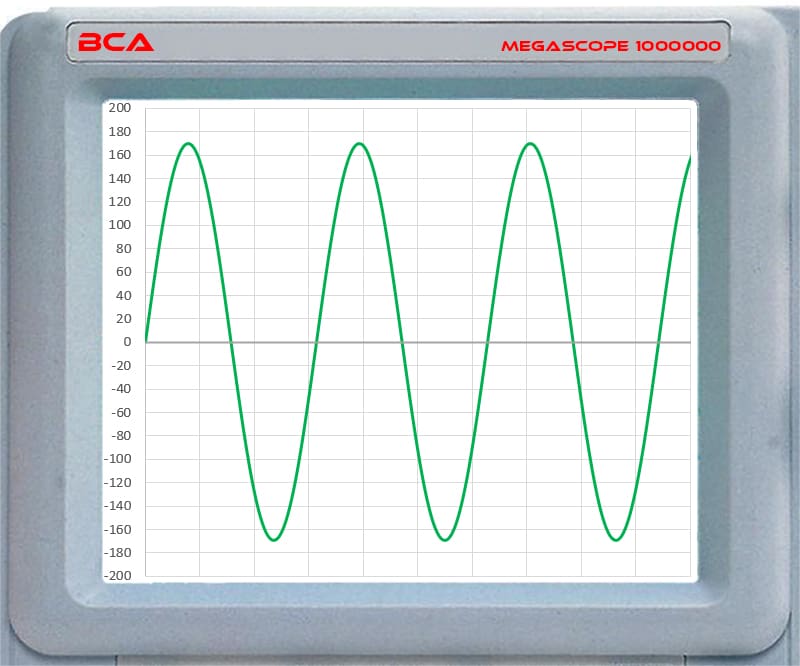
If you look closely at the graph above, you’ll see the waveform reaches just under 170 volts above the zero-crossing and the same -170 on the negative side. The actual voltage might be 169.7056 volts peak. That’s a peak-to-peak voltage of more than 339 volts. If we want to calculate the RMS voltage, we take the peak voltage of 169.7056 and divide it by the square root of two. We get an RMS voltage of 120 volts.
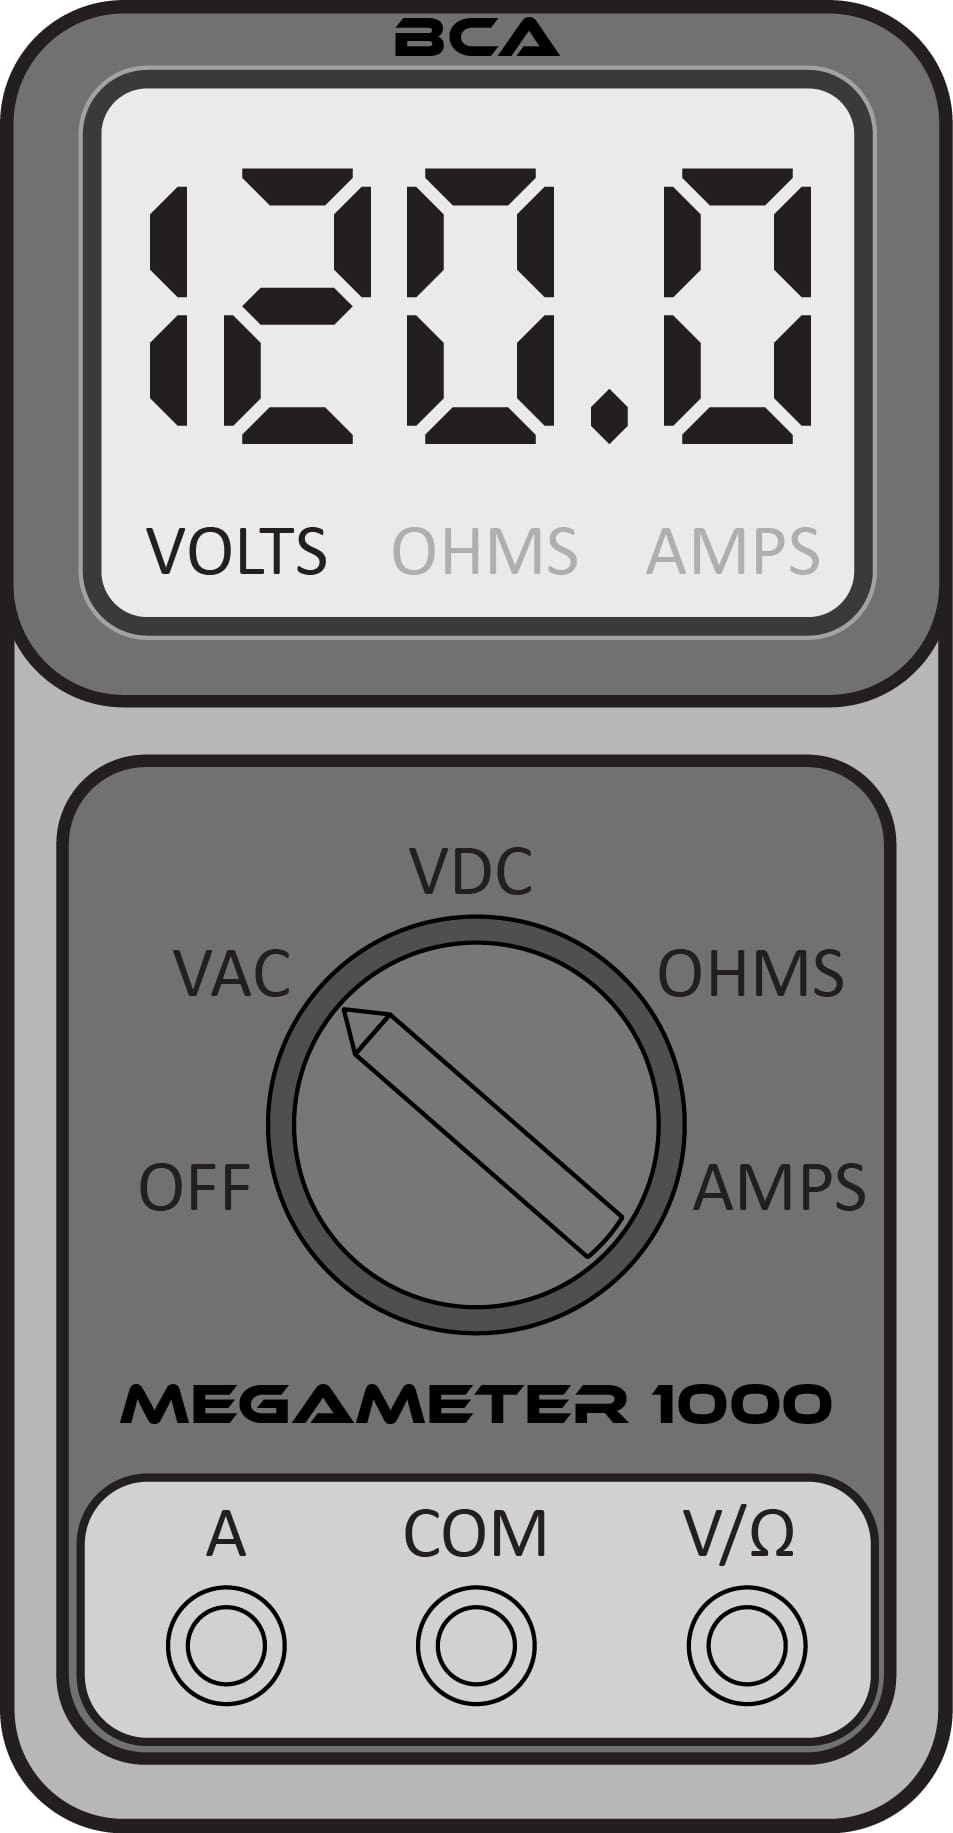
This is what the BCA Megameter 1000 would display if connected to the same wall outlet.
Visualizing RMS Voltages
Understanding AC calculations is a bit counterintuitive. As such, let’s work on a way to visually represent why we need to convert peak or peak-to-peak voltages into an RMS voltage. Let’s start with our sine wave again.
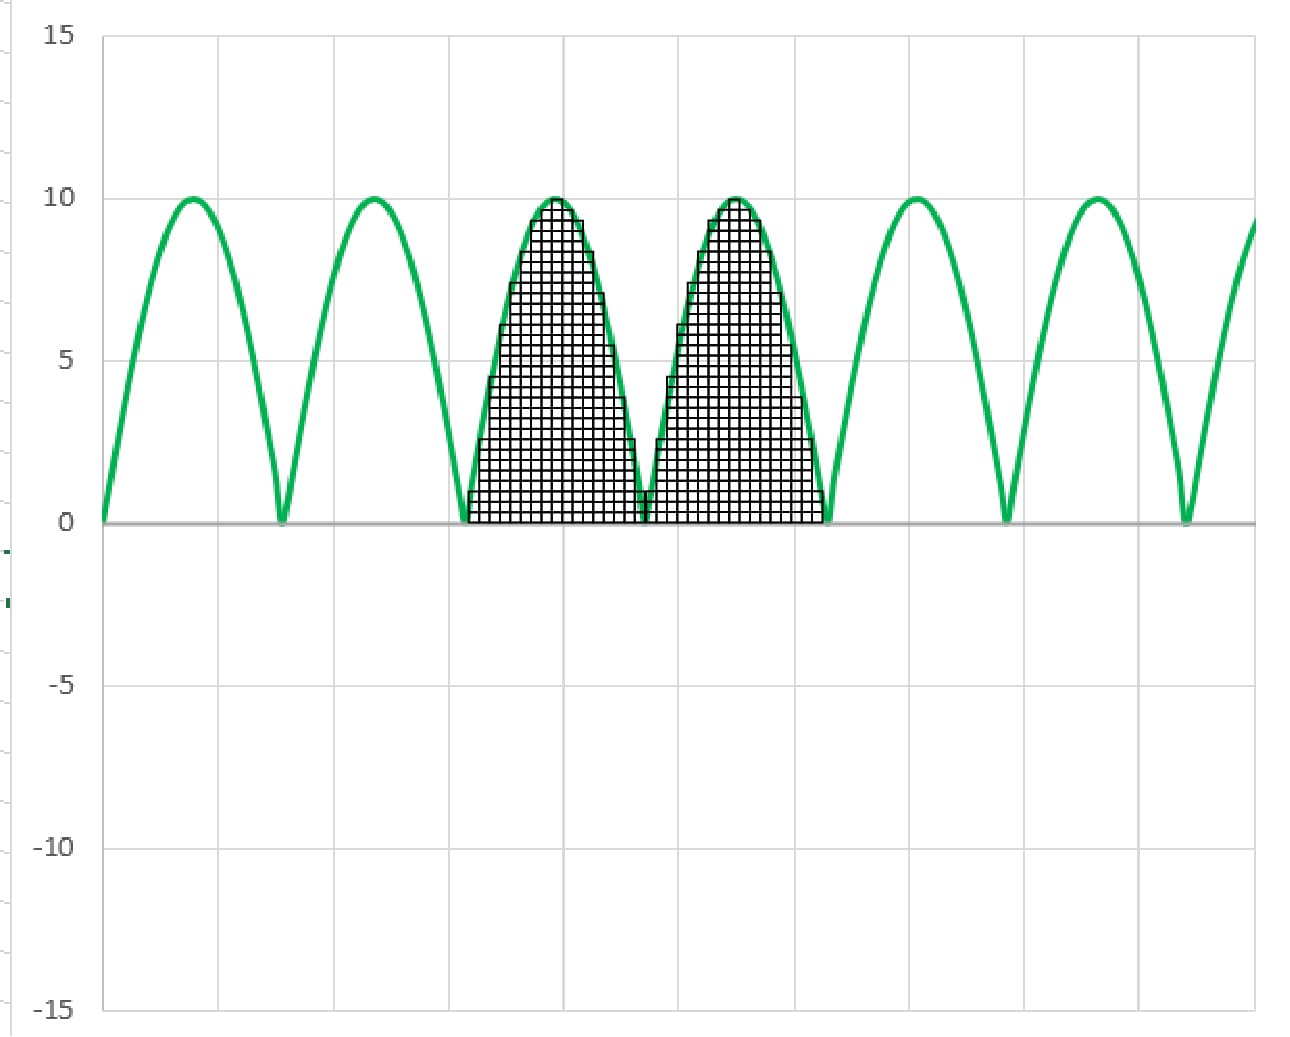
Now, let’s break this into little blocks so we can understand the total amount of energy the waveform contains.
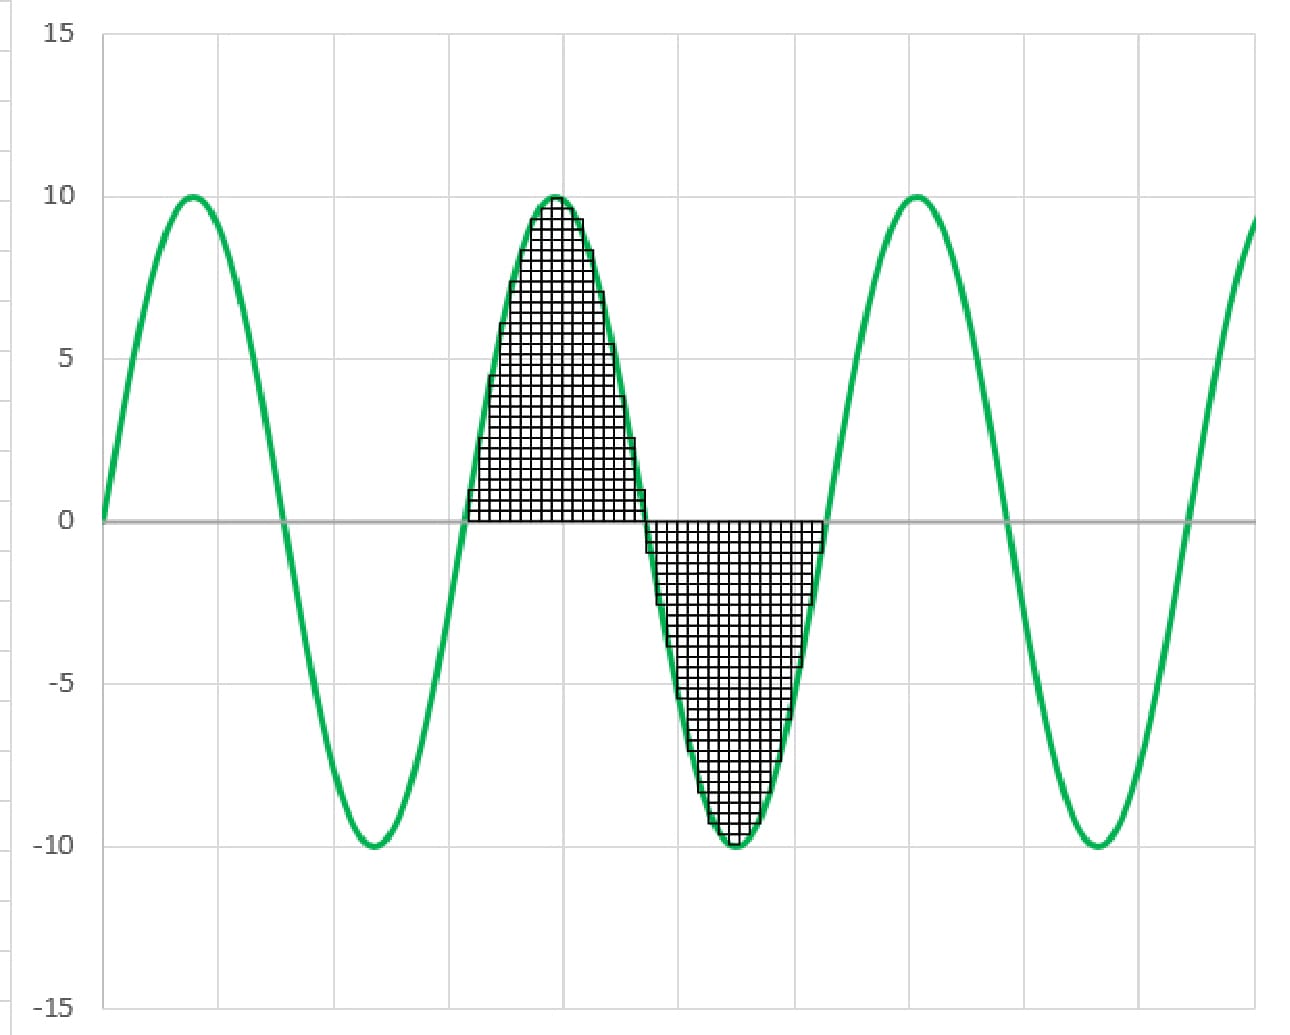
Now, we’ll look at the waveform in terms of its peak level rather than peak-to-peak. You can see it has the same number of blocks.
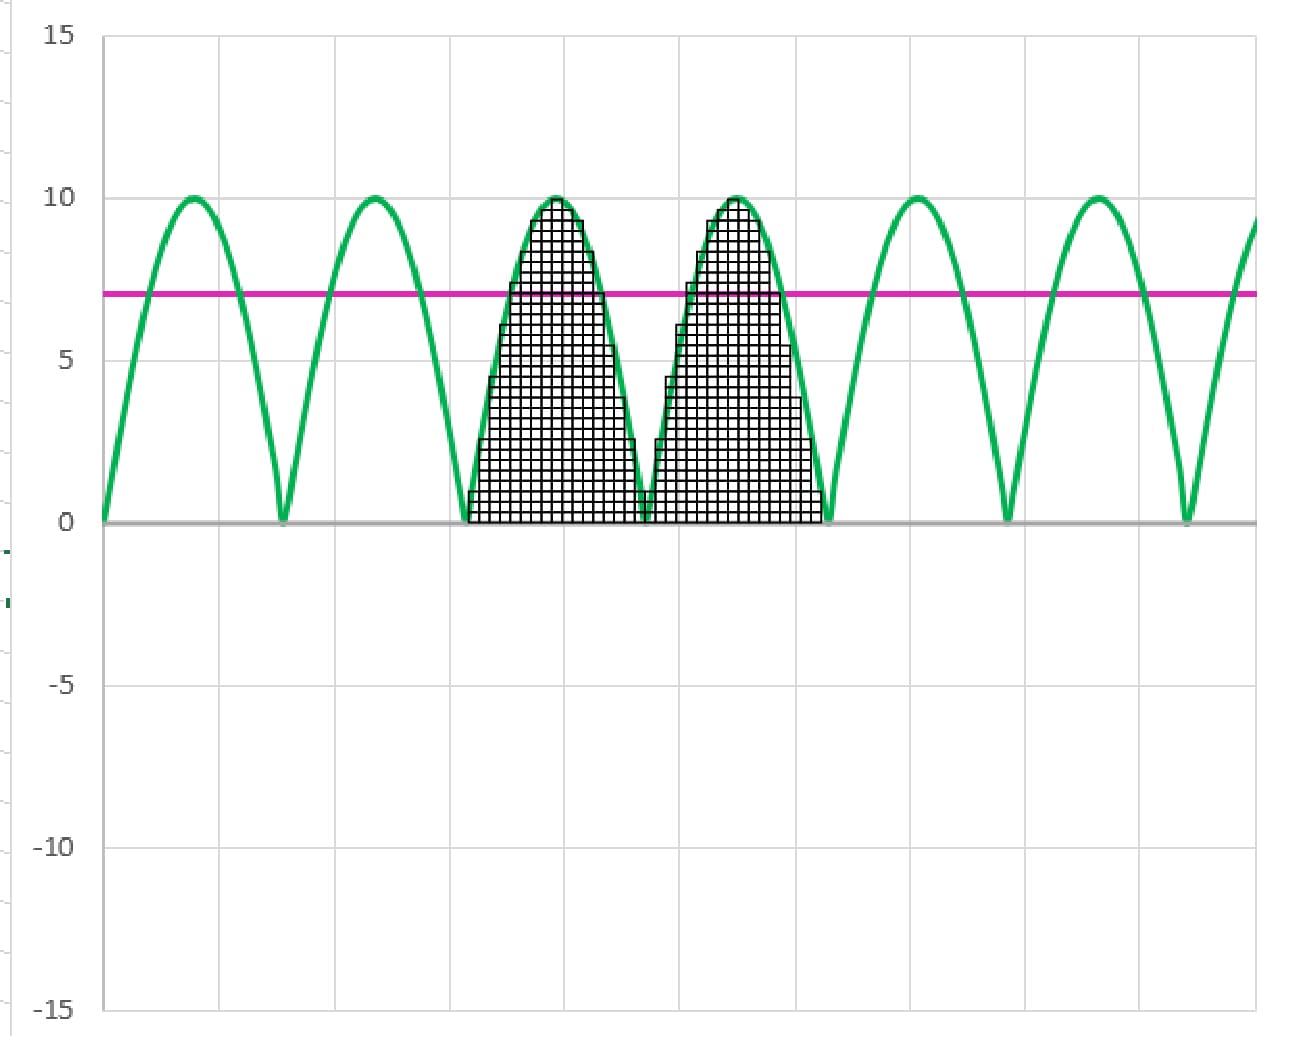
Next, let’s add a line showing us where our waveform’s RMS level would be.
Next, we take the blocks that are above the RMS level and use them to fill in the gap between the peaks.
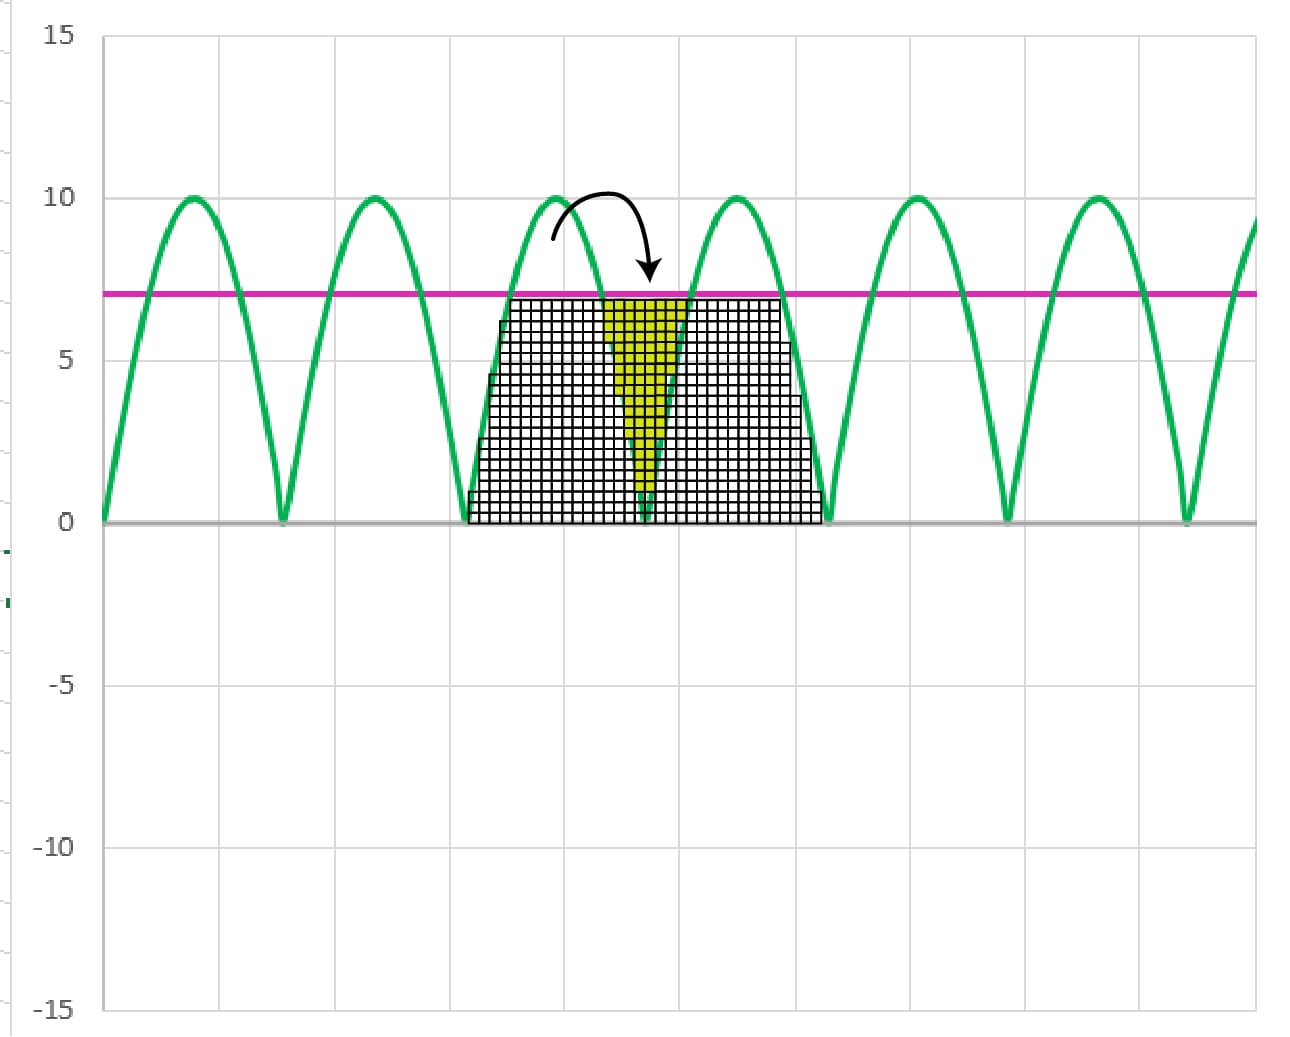
While this is just a graphical approximation, we can see that the blocks above the RMS equivalent level fill in the gap between the next period of the waveform.
AC Current Measurements
Given the above explanation, it makes sense that we would measure current using the same Root Mean Square concept. We don’t typically care if there is a brief moment where the current is 0. Likewise, we don’t care if the current is briefly higher than the RMS equivalent level, as it’s not there for long.
RMS current measurements are what we use to determine the size of wire required for a specific power output level from an amplifier to a speaker with a specific load at a specific distance.
RMS Power and AC Calculations
We’ll wrap this up with a clarification. Technically, there is no such thing as an RMS Power calculation. Power calculations in AC waveforms are always performed using the RMS current and RMS voltage. In reference to the ANSI/CTA-2006-D standard for car audio amplifier power measurements, the proper term to describe a steady-state power level would be Continuous Power. You can also say Average Power or Real Power. However, the latter opens up a new can of worms when current and voltage are not in phase across the load. As you can expect, we’ll talk about peak continuous, dynamic, music, and max power ratings another time. The same goes for power calculations in reactive AC loads. Don’t fret; we’ll make sure it’s crystal clear.
The next lesson will talk about the Decibel.
